













The list form always presents a list of records in the application. However, the regions available in a list form can vary based on the application type. For example, these diagrams represent standard list forms and their regions:
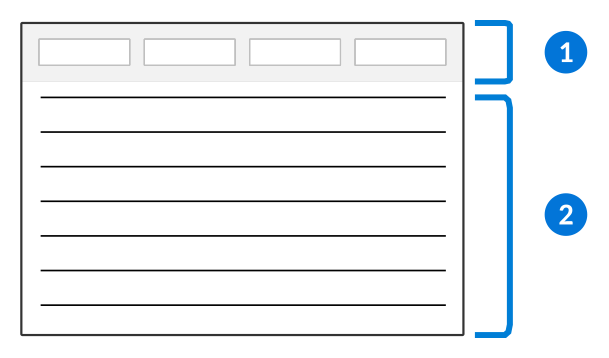
 | Column headers—Represents the fields within your application. Often, column headers contain filter fields which you can use to sort and search the list. Learn more in Column header filters. |
|---|---|
 | Detail list region—This is a list of records in the application with columns representing key fields in the records. Depending on the application, you may or may not be able to edit fields directly in the detail list. You can also open the detail for a record and see any additional fields that are not included in the list form. |
Some applications have a filter header region above the column header. Learn more in Filter headers.
Advanced navigation
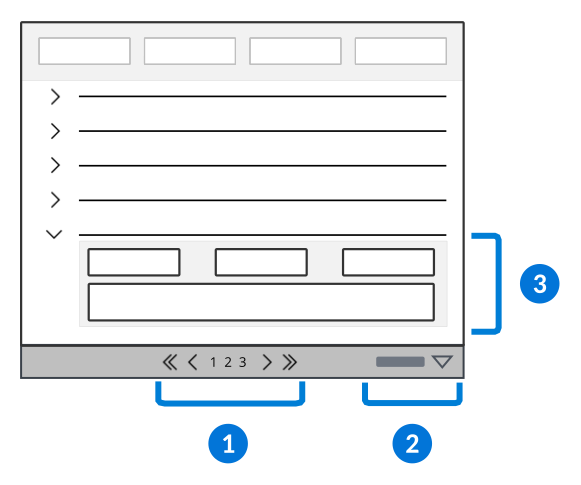
| Page navigator—Page navigation controls appear at the top and bottom of detail list regions, and offer a way to control how many rows appear on a single page. Use the page numbers and arrow buttons to load additional pages of results, and the drop-down to determine whether the list shows 15, 25, or 50 results on a page. |
|---|---|
| Column controls—The Columns Menu gives you control over the order of columns, as well as the ability to hide, show, freeze, or unfreeze different columns in the list form. Depending on the application, the menu is accessible from either the column header or the bottom of the list form. |
 | Row expansion—Some applications include additional details for a record that can be viewed from the list form by expanding the row. When available, select the row expansion icon to see these additional fields. |
Stacked View
List forms viewed on smaller screens, such as mobile devices or compressed browser screens, have the option to toggle between the Stacked View and Table View. The Stacked View displays records from the list form in a stacked format, while the Table View reverts to the default list form format.
Mobile devices open to the Stacked View by default, but you can select the Table View  icon at the bottom of the list form to switch views.
Visualization controls
Visualizations are charts, graphs, or boxes that represent application data which are displayed in interactive reports, the list forms of applications, and dashboard pages.
When you open the application or dashboard page, you see the visualization, the visualization controls, and the detail list region. The visualization displays data from application records. Use the column header filters to change which records display can also filter what information shows in the visualization.
When an application has more than one visualization configured they're listed in the Selected Visualization menu. To hide a visualization, clear the selection in this menu. To hide and how the detail list of the application use the Detail List toggle. To see more details like specific values or labels use your mouse in the plot area to hover over different parts of the visualization.
The diagram below shows the different areas and controls of a visualization in the list form of an application:
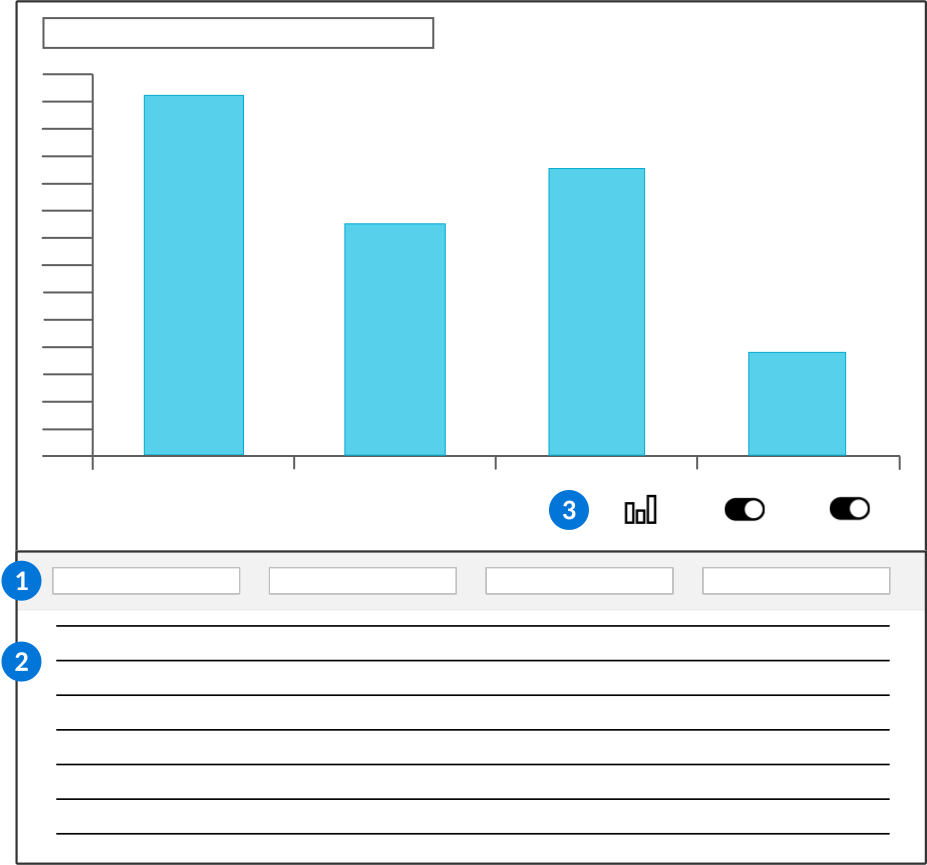
| Column Header—Use the filters fields in the column header to sort and search the list. Filtering the records in the detail list also filters the information that displays in the visualization. |
|---|---|
| List form—View the application records which are summarized in the visualization. |
| Visualization controls—Control aspects of your visualization, such as:
|
Columns Menu
Control the display and order of columns in the list form of an application using the Columns menu.
In the list form of an application, you can drag columns to new positions, and drag the edge of a column to change its size.
There are additional options to adjust columns in the Columns menu, located at the bottom of the list form. You can:
- Change the order of columns.
- Freeze and unfreeze columns by moving them between the Frozen Columns and Unfrozen Columns lists using the Previous
 and Next
 buttons. Frozen columns do not move when you scroll left and right.
- Reset the visibility, sort, order, and size of the columns.
- Clear any filters applied in the column header filter fields using the Clear Table Filter button. This does not override a saved filter applied from the Filter menu.
Row action menus
The Row action menu is the entry point to actions available for individual records. Primarily, you'll use this menu to edit a record.
In the list form, select the Action  icon located next to each record in the list to open the Row Action menu.
Actions available in this menu vary by application. The following are the most common menu options:
 Edit | Open the detail form of the record. |
 | Delete the record. |
 Get Shareable Link | Generate a link that opens to the environment, lifecycle, and record. |
 Attachments | Open a dialog box to view all images and files attached to the record. From this dialog box you can select the attachments you want to download, or upload new attachments. |
 Export CSV | Download a CSV file of the records displayed. |
Favorite actions
Add actions you use frequently as favorites. When the row action menu is open, press and hold the Option ⌥ key on Mac or the Shift key on PC, and then click the action you want to add as a favorite.
When you select a row in the list form, your favorite actions display. Learn more in Favorite buttons.
Filter headers
Some application list forms have a filter header in addition to the filter fields in the column headers. Use the filter header to enter values and quickly find the records that you need.
When the list form of an application has a filter header, it appears above the normal column headers. Enter values in the filter header fields to display the records that match your criteria.
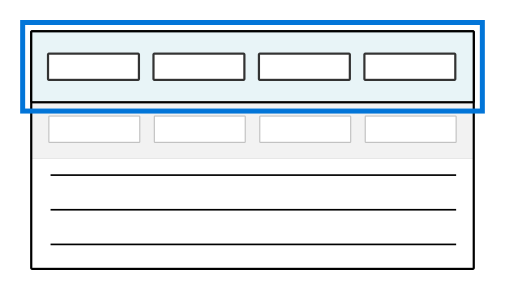
You can further refine the visible records with the filter fields in the column headers, but some applications require that you enter values in all filter header fields before displaying records. If this is the case, you will see the following message in the application: Apply all header filters to get records.
Editable lists
Applications can be configured so that records can be edited in the list form. When the list form of an application is editable, you can quickly edit and create records in the list form.
Select a field to make changes when the list form is editable. If the list is not editable, you can double-click the record to open the detail form. If the list is editable, you must use a row action to open the detail form.
After you've made changes, you can either select the Save  button to save your changes, or the Cancel
 button to discard your changes. If you exit the application without saving your changes, you may lose them.
Select the Add button at the bottom of the form to add a new record. You won't be able to save the new record until you've completed all required fields.
Gantt
The Gantt application pattern displays event and task based records for project scheduling in list and visualization regions.
This application pattern is useful for showing tasks which must be completed, and the time required. The following diagram represents a Gantt application pattern and its regions:
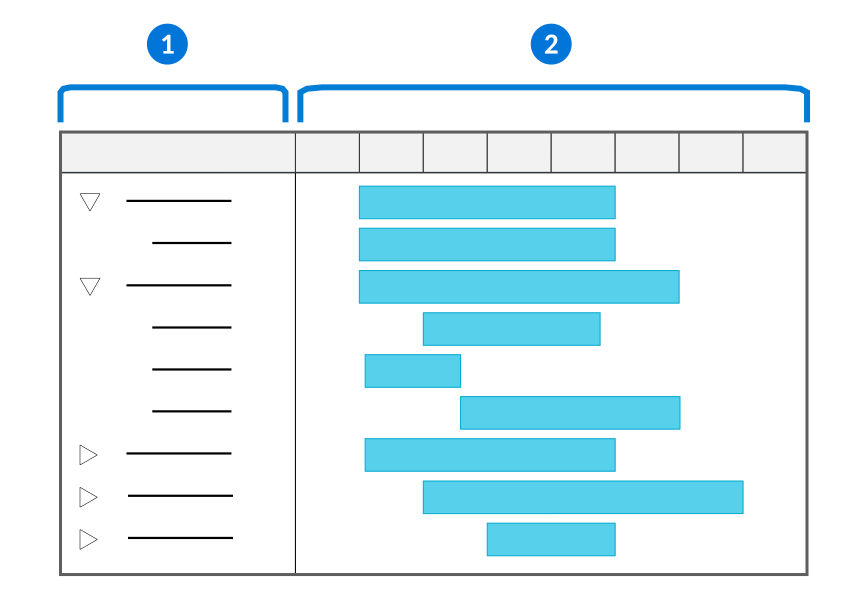
| List region—Expand records in the list region to see the components that make up each record, and to view them in the visualization. |
|---|---|
| Visualization region—Each record or component of a record is represented by a bar and shows the start date, duration, and end date of the event or task. |
Gantt applications are often read-only, though some allow editing by selecting components of the visualization or a record from the list region.