














The Logic Block Debugger runs a logic block a single action at a time. Once you identify issues, you can open the logic block in the Logic Block Builder to fix them. Learn more in the Run a logic block debug session topic.
Debugger components
Use the different tools and buttons in the Logic Block Debugger to control which actions are run. Other components of the debugger allow you to view table data, field values, and other information in your logic block.
Like the Logic Builder, the Logic Block Debugger is comprised of different panels. Each panel serves a different purpose in debugging a logic block, as described below:
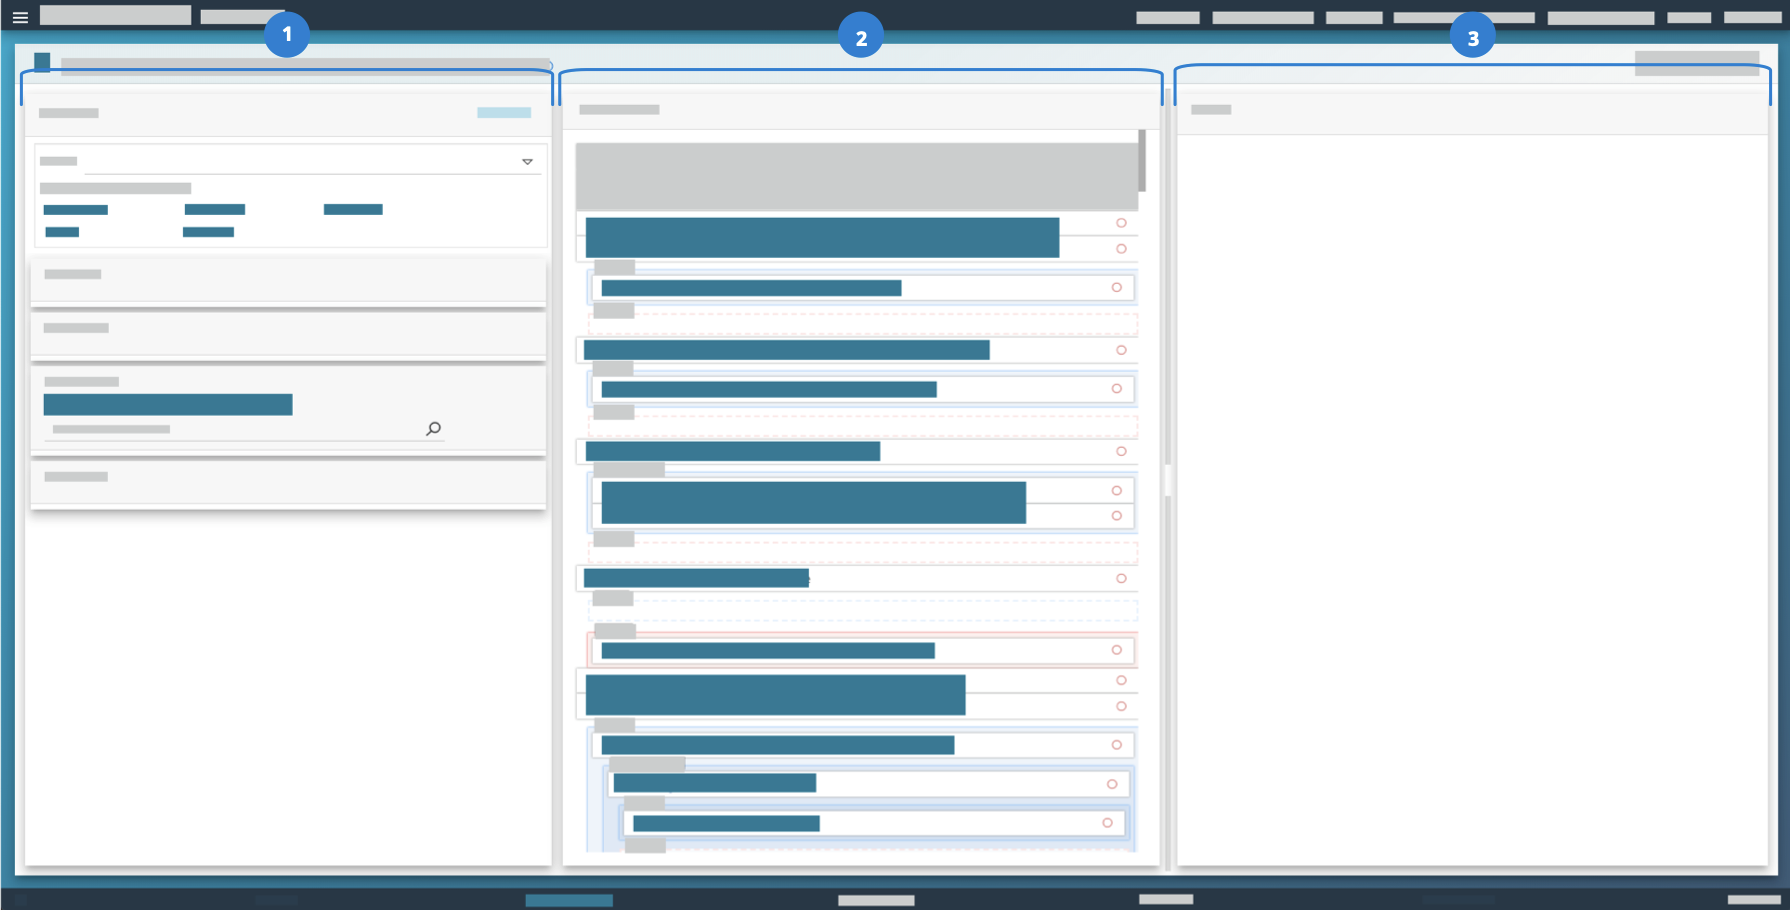
 | Debugger—Control the logic that runs, and view information specific to your session. Includes the current state of the data for whatever action is currently selected. The Debugger panel includes several components, such as:
|
|---|---|
 | Logic Block—View the actions that make up the current logic block. Select actions and set breakpoints in this panel. |
 | Details—View the configuration of each action. |
Run controls
Run controls determine how actions run in the Debugger. These controls include:
- Step Over—Run the selected action. For example, this runs a Set Values action, and then stop.
- Step Into—Open the logic block being called or run as a result of an action in the Logic Block panel. For example, you can step into a logic block from a Call a Logic Block action. You can also step into a table trigger logic block that runs as a result of an Update Records action.
- Step Out—Close a called logic block and return to the calling logic block. This closes a logic block that ran as a called logic block or as the result of an action. You can also use this control to step out of a loop.
- Run—Run all the logic block actions before or after a breakpoint. This does not stop on selected actions.
- Run To—Run the logic block up to a defined breakpoint or selected action.
Breakpoints
Breakpoints allow you to specify a point in the logic block where you want the debugger to stop running. This means the logic runs up to that set point, without having to step over individual actions. For example, if you want to see what values are in a field before a Set Values action, you could set your Set Values action as a breakpoint. Then, when you run your logic block in the Debugger, it would run up until the action you specified, but would stop before the Set Values action is run.
Breakpoints can be created, modified, and removed from the debug session or the Logic Block Builder. To set or remove a breakpoint, select the Breakpoint toggle on the action before running the logic block. Optionally, select the dropdown menu on the action to create a conditional breakpoint. Conditional breakpoints are only set when the conditions you specify are met. This is helpful when you debugging data within a loop.
After you have breakpoints configured, you can:
- Clear Breakpoints—Removes all set breakpoints in this session.
- Disable Breakpoints—Temporarily turn off breakpoints so that you can run through the logic block, but keep the actions configured as breakpoints.
Breakpoints are unique to user, environment, and lifecycle, and persist between debugging sessions, even if you don't save the logic block before you exit. This means when you debug a logic block and set a breakpoint, that breakpoint still exists the next time you debug. This helps when repeatedly debugging a save with multiple triggers, or when debugging a logic block with multiple nested logic block calls. Any breakpoints older than 30 days are automatically cleared.
The Logic Block Breakpoint Utility application allows you to view which logic blocks and lifecycles you have breakpoints in, and to quickly remove a large quantity of breakpoints from different logic blocks and actions in one place. Access this application from the navigation menu.
Run a logic block debug session
Use the logic block test debugger to troubleshoot problems with logic blocks.
To enable logic block debugging, select the Logic Block Debugging toggle located on the Settings page of the User Profile menu. The User Profile menu is accessible from the main menu bar.
Start a debug session from the application
In the Application Builder application, the Debug dropdown menu is available on any part of the application once debugging has been enabled. Select the actions you want to debug from the list of the logic block actions attached to the Debug menu. For example, if you select Delete on the Debug menu, a debug session launches on delete of any record from the list form.
Perform the actions that runs the logic block you selected to debug. This opens the Debugger window over the current application. For example, if the logic block is configured as a Field Value Changed event, if you change the field value in the application associated with that event, the Debugger window opens.
In your session, use the controls in the Flow Control panel to run the logic block. Learn more about these controls in the Logic block debugger topic.
If you close the debug window before you're done debugging the logic block and have not selected the Cancel button, you can still access the session in the Logic Builder.
Start a debug session from the Logic Builder
In the Logic Block Builder application, you must:
- Open the Logic Builder inside the logic block record.
- Select the Debug button, or select Debug Session from the Session dropdown menu in the Debugger panel.
If you are trying to open a previous session that you haven't cancelled, you must be in the same environment and lifecycle as where you ran the logic block.
End a debug session
There are several ways to end a debug session, such as:
- Select the Cancel Debug Session button in the application window.
- Select the Cancel button in the Debugger window.
- Run the last action of the logic block. This completes the session.
Ending a debug session doesn't automatically close the Debugger window. If you don't close the Debugger window and start debugging a different logic block, the same window is used.
Ending a session means that you can't use the Debugger to run any other actions.
Logic Block Breakpoint Utility application
The Logic Block Breakpoint Utility application allows you to view which logic blocks and lifecycles you have breakpoints in, and to quickly remove a large quantity of breakpoints from different logic blocks and actions in one place.
Debug logic blocks initiated by inbound endpoint request
Configure your inbound request payload with additional parameters in order to debug the logic block initiated by the endpoint.
In your request payload, you must:
- For endpoints with triggers or action blocks, add "nwDebugMode": true to the body of the payload and submit it.
- For traditional logic blocks on
:executeendpoints, add “debug": true to the body of the payload and submit it.
Open a logic block record in the Logic Block Builder, then:
- In Options, toggle Debug on.
- Refresh the session. This opens the created debugging session.