














Visualizations display the information saved in application records, as well as related information such as the sum of values in multiple records. Visualizations show data at a specific point in time, and require additional configuration to display a progression of data over time. The visualization displays at the top of the list form of an application, above the column headers of the detail list region. You can configure one or more visualizations for an application.
Visualizations are part of the application definition and use data mappings or the Visualization Builder to define different attributes such as the type, values, or labels. Both configuration options are available on the Field Dependencies page of the application. The type of visualization determines how the data is displayed. Learn more in the Visualization types topic.
Learn more in the Visualization data mapper configuration and Visualization Builder topics.
Visualization Links
You can use application links to attach additional visualizations to an application. When a user interacts with components of an application's existing visualization, they can navigate to other visualizations with related data.
For example, if you are in the list form of the Supplier Invoices application which has a visualization for the company totals. A component of the company totals are the company credits. You can configure a visualization link so when a user selects the company credits part of the visualization, it navigates them to the general ledger record that shows a different visualization built over the company credits.
Learn more in the Connect to other visualizations with application links topic.
Visualization Filters
Many visualization types are capable of being filtered. You can select a component of the visualization in order to filter the records being shown in the list form by that value. Select the part of the visualization you want to filter with, and then select the Filter  icon located under the Action menu. To clear the filter, select the Clear Filter
 icon.
Visualization data mapper configuration
Configure a visualization using the data mapper to display data from an application's records in a visual format, such as a graph or a chart.
To add visualizations to an application, you must:
- Access the Visualization Builder or add data mappings in the Visualizations subtable on the Field Dependencies page.
The following tables show the mappings which are required for every visualization, the series mappings which dictate how the records are processed, and the optional mappings.
Required Mappings
There are several mappings which are required for every visualization, such as:
| Mapping | Defines | Details |
| Type | The type of visualization to display. This determines the other available data mapping options. | Only one visualization type can be defined for each visualization. Define this first in your data mapping. |
| Title | The name of the visualization that displays in the Selected Visualization drop-down menu. | Only one is defined for a visualization. This can be a constant. Any text can be used for the title. |
Series Mappings
There are different mapping options which dictate how the visualization processes the records.
The table below details the configuration options for Aggregation Based (Ungrouped).
| Mapping | Defines | Details |
| Series Label | Distinguishes between grouped or ungrouped aggregations. The label of the data being displayed in the visualization. This label displays under the visualization. | Only one series label of Column Headers of Y-Axis can be defined for each visualization. |
| Y-Axis Use | The aggregations to perform over the application table and that represent the data displayed in the plot area. | You need at least one Y-Axis configured. This can be an average, a count, a maximum, or total. The order you configure the fields in is the order in which they appear in the visualization. |
The table below details the configuration options for Aggregation Based (Grouped).
| Mapping | Defines | Details |
| Series Label | Distinguishes between grouped and ungrouped aggregations. The label of the data being displayed in the visualization. This label displays under the visualization. | Only one series label of Value of Group By can be defined for each visualization. |
| X-Axis Use | The field you want to represent on the x-axis and to group the aggregation by. | You need at least one X-Axis configured. This must be a Group By field. The order you configure the fields in is the order in which they appear in the visualization. |
| Y-Axis Use | The aggregations to perform over the application table and that represent the data displayed in the plot area. | You need at least one Y-Axis configured. This can be an average, a count, a maximum, or total. The order you configure the fields in is the order in which they appear in the visualization. |
Optional Mappings
The table below details the optional configuration options for visualizations.
| Mapping | Defines | Details |
|---|---|---|
| X-Axis Label | The label that displays under the x-axis in the plot area. | Only one is defined for a visualization. This is a constant. Any text can be used for the label. |
| Y-Axis Label | The label that displays next to the y-axis in the plot area. | Only one is defined for a visualization. This is a constant. Any text can be used for the label. |
| Y-Axis Minumum | The minimum value of the y-axis. | Only one is defined for a visualization. This is a constant. Only numbers can be used for this value. |
| Y-Axis Maximum | The maximum value of the y-axis. | Only one is defined for a visualization. This is a constant. Only numbers can be used for this value. |
Visualization Builder
Use visualizations to display data in a visual format, such as a graph or pie chart. Build visualizations in the Visualization Builder accessible from the Application Builder and Interactive Report Builder.
A visualization is built from records in a table. Filters applied to the data table also apply to the visualization. There are multiple places to use visualizations, such as:
- Applications—The visualization appears above the data table on the list form of the application. When there are multiple visualizations configured, a dropdown menu allows users to select which is visible. Configure application visualizations in the Visualizations section of the Configuration panel.
- Dashboards—The visualization appears as a read-only display of the data in a dashboard card. Configure dashboard visualizations in the application, then reference the application in a dashboard card.
- Interactive Reports—The visualization appears in reports. Configure report visualizations in the Visualizations tab of the Interactive Report Builder.
There are three panels used for configuration in the Visualization Builder. Each panel serves a different purpose in configuration, as seen in the diagram below.
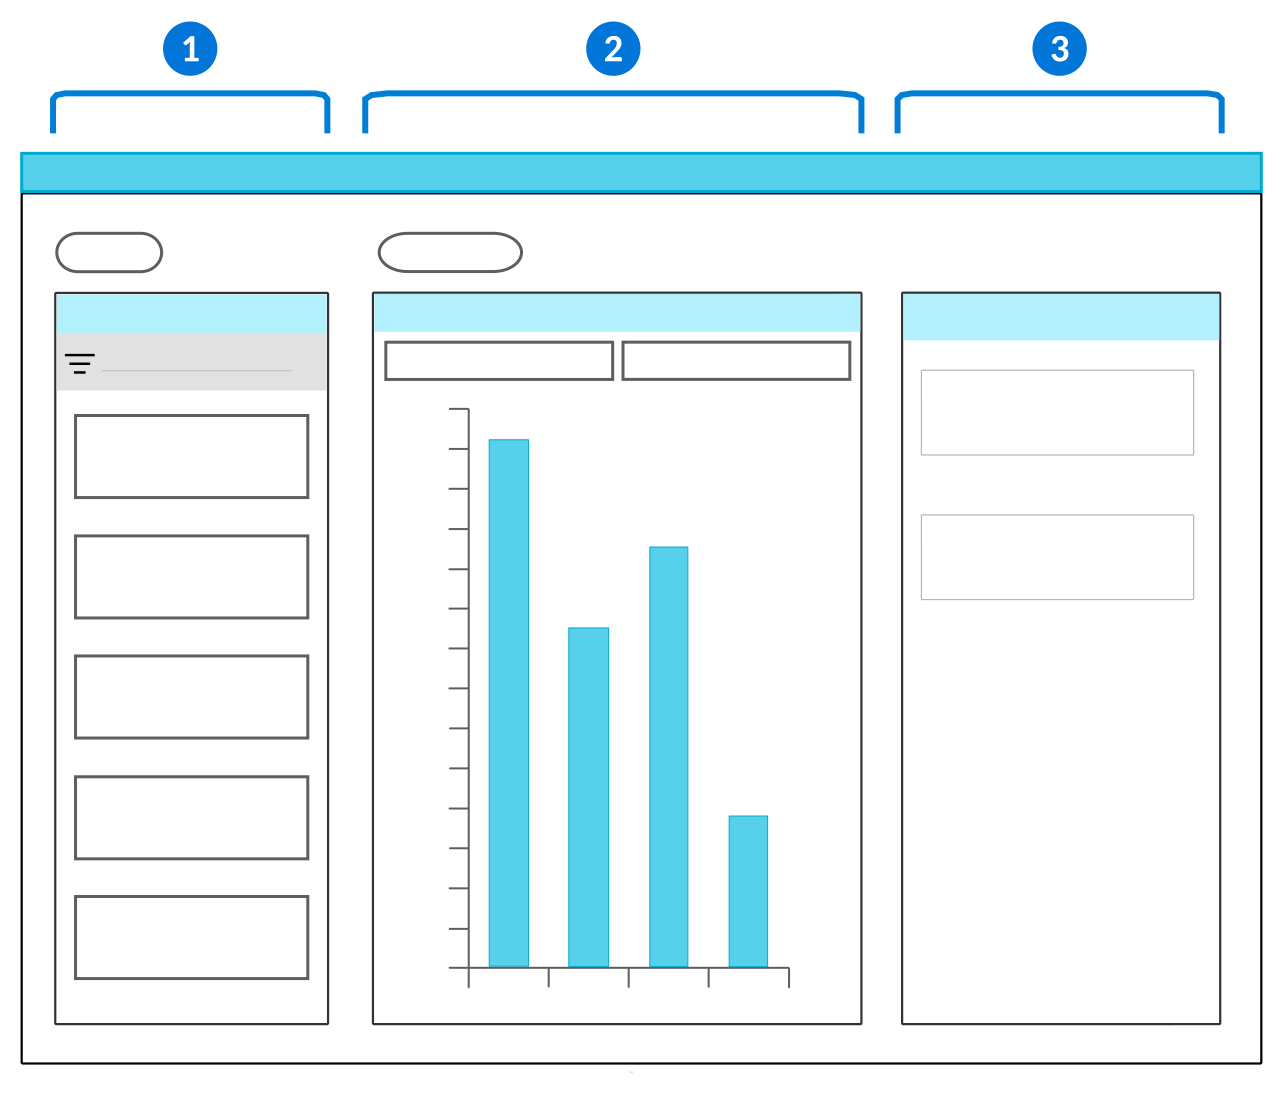
 | Fields panel—Containsthe fields you can use to build your visualization. Use the drag and drop function to move the fields from the Fields panel into the Viewer panel. |
 | Viewer panel—Contains the x-axis and y-axis fields where you can drop the fields you selected from the Fields panel. You can only have one field in the x-axis field, but there is no limit on how many fields can be placed in the y-axis field. Select the visualization Type to determine how the data is shown. See the Visualization types topic for more information. |
 | Details panel—Contains the characteristics and attributes of the fields you select. Additionally, enables you to group the data or select different color formats. Color formatting allows you to define conditions and colors for different stylizations of the visual data. For example, you can:
|
Certain visualization Type also must be configured with a Data Shape to further define how the data is shown. There are multiple data shapes to choose from, such as:
Row Based—Values of each y-axis field are plotted on the visualization as separate series on the visualization. Values of the x-axis field create the categories on the x-axis.Aggregation Based—Values of the y-axis provide aggregations of all the application records instead of displaying specific values. Values of the x-axis field group the aggregated values from the y-axis. For example, a count of unpaid invoices is your y-axis, grouped by each month in the year as your x-axis.Column Based—Values for the x-axis and y-axis come from the same data item. The value of the record is used for the y-axis. The label of the data item found on the Synonyms page is used for the x-axis. Select as many data items as you want to appear on the visualization.
See also Visualizations in interactive reports.