












Performance data includes the time that a particular activity took to complete and the number of times the activity was executed. An activity is an individual action that occurs automatically as a result of an initial user interaction with an application. Activities can include logic blocks, database transactions, commitments to NATE containers, calls to external endpoints, and more. Collect this performance data and then analyze it in different ways using the Application Monitoring Utility and Application Monitoring Workbench applications.
For example, you could use application monitoring to collect data on all the activities that are triggered when you select a particular form action, including logic blocks, database transactions, and more. You expect the business logic of this action to insert three records into a table. However, when you examine these activities, you might notice that there are actually nine database transactions recorded, including six insert transactions and three delete transactions. Using the information derived from application monitoring, you could examine the transaction boundaries the related logic blocks run in, and make changes to improve the performance of the form action.
In order to make the most out of application monitoring, you should have an understanding of the activities you expect to be collected as your business logic is executed. In addition, application monitoring is best suited for discrete business processes. A single user action can trigger thousands of activities, so you should only monitor a single process at a time. Learn more in Application monitoring best practices.
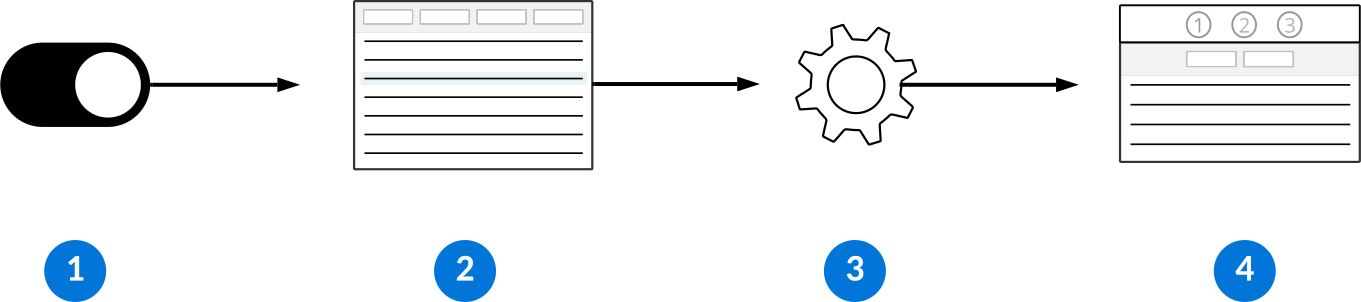
The following diagram shows the process of collecting and analyzing performance data:
 |
|
|---|---|
 | The Application Monitoring Utility application contains all the recent monitoring data for every session started by users in your environment. Filter for your session by name to see the data you need to examine. Each record represents a single activity and the time it took to process. Use the Drill Down row action on an activity record to view all the activities that began between the activity's start time and the end time. For example, you could drill down into a logic block activity and see the database transactions that occurred as a result of the logic block. After you drill down, you can open the detail form of each activity record. Learn more in Application Monitoring Utility application. |
 | To examine a session in more detail, use the Generate Session Analysis row action in the Application Monitoring Utility application on an activity in your session. After generation is complete, you can use the View Session Analysis row action to open the Application Monitoring Workbench application. |
 | Use the Application Monitoring Workbench application to view generated summaries of session data. This is the same performance data collected in the Application Monitoring Utility application, but it's modified and aggregated in different ways, allowing you to analyze logic blocks, SQL statements, table interactions, and more. Learn more in Application Monitoring Workbench application. |
Logic block log messages
In Logic Block Builder, you can use the Log Message logic block action to surface additional information in the application monitoring applications. When you monitor a process that includes a logic block with log messages included, you can view activities of type Log Message, which contain the information defined in the Log Message action.
For example, if you have a logic block that conducts a calculation, you can capture the results of that calculation in a log message. If you monitor the process in which this logic block runs, you can filter for the log message in an application monitoring application. This allows you to verify if the calculation is correct.
In addition, you can use log messages to determine whether certain logic block actions are being performed, and to filter activities down to the segments of your business logic which require attention. Log messages have no impact on performance and are only generated when the logic block runs during an application monitoring session.
Application Monitoring Utility application
The Application Monitoring Utility application contains performance data collected on applications and application components in your environment.
Performance data is made up of individual activities that occur when a user interacts with an application. Each record in the Application Monitoring Utility application represents a single activity and how long it took to complete. It also includes additional information depending on its type. For example, a database transaction activity contains a SQL statement, while a logic block activity includes the name of the logic block.
Activities are collected during monitoring sessions that can be performed by any user in the environment. The Application Monitoring Utility application contains activities from all sessions conducted in the last ten days. Filter for activities that are part of a specific session using the Session Id field. Both activities that occur as a result of a user interaction and those that are part of a background task are collected, even if the background task starts after the monitoring session ends. Learn more about monitoring sessions in Application monitoring.
Use the Drill Down row action to view all the activities that occurred between that activity's start and end time. For example, you can drill into a logic block activity to see the database transactions that took place while the logic block was processing.
Generate a session analysis
Sometimes, you can get the information you need from the Application Monitoring Utility application. However, you can Use the Generate Session Analysis row action on one of the activities in the session to analyze a session in more detail.
After you're notified that the generation is complete, use the View Session Analysis row action to open the Application Monitoring Workbench application. There, you can view the performance data in different ways to analyze logic blocks, SQL statements, table interactions, and more. Learn more in Application Monitoring Workbench application.
Application Monitoring Workbench application
The Application Monitoring Workbench composite application contains performance data that is parsed and summarized in different ways. Application developers analyze this information to optimize the performance of their applications and troubleshoot issues.
For example, if you wanted to find out why it's taking longer than expected to save a record in an application you built, perform a monitoring session and generate a session analysis. You may discover that a logic block triggered when a record is saved fetches the same record multiple times when it only needs to fetch it once. With this information, you can refine the design of your logic block and optimize the performance of your application. Learn more in Application monitoring.
The Application Monitoring Workbench application contains all the session analyses that have been generated in your environment. You must use the Generate Session Analysis row action on a record in the Application Monitoring Utility application to view the associated session in the Application Monitoring Workbench application. After you use the filter header in the Session Summary application to view a single session, the same filter is applied when you move between each application.
The Application Monitoring Workbench application is made up of the following components:
- Session Summary application
Use the Session Summary application step to filter for your application monitoring session across all application steps in the Application Monitoring Workbench application.
- Parsed Session application
Use the Parsed Session application step to view all the activities that occurred during the monitoring session. This application step is most useful for filtering for specific activities.
- Table Summary application
Use the Table Summary application step to view a list of all the tables accessed during the monitoring session based on the type of database transaction activity that occurred. Each record displays the number of queries, updates, inserts, or deletes performed on a specific table.
- SQL Summary application
Use the SQL Summary application step to view each unique database transaction activity that occurred during the monitoring session, the number of times the SQL statement was executed, and the average time it took to process.
- Embeddings SQL Summary application
Use the Embeddings SQL Summary application step within the Application Monitoring Workbench application to examine the SQL statements that pertain to the Nextworld Intelligence semantic search utilities.
- Logic Block Summary application
Use the Logic Block Summary application step to view each unique logic block that processed during the monitoring session, the number of times it was executed, and the average time it took to process.
- Data Import Summary application
Use the Data Import Summary application step within the Application Monitoring Workbench application to review the performance of data import definitions.
- Call Stack application
Use the Call Stack application step to view the logic blocks that ran during your monitoring session in a hierarchy. When evaluating performance, the Call Stack application step is a useful starting point to narrow down the areas of your business logic that could be improved for performance.
Session Summary application
Use the Session Summary application step to filter for your application monitoring session across all application steps in the Application Monitoring Workbench application.
This application step also provides an overview of each of the session analyses generated in your environment. Use the Edit row action on a session to view the total time for all the activities in the session and the total number of activities by activity type.
Parsed Session application
Use the Parsed Session application step to view all the activities that occurred during the monitoring session. This application step is most useful for filtering for specific activities.
The Parsed Session application step displays activities in way a similar to the Application Monitoring Utility application. However, the details of each activity are separated into multiple fields so that the activities can be filtered in additional ways.
Use the Drill Down row action to view all the activities that occurred between that activity's start and end time.
Table Summary application
Use the Table Summary application step to view a list of all the tables accessed during the monitoring session based on the type of database transaction activity that occurred. Each record displays the number of queries, updates, inserts, or deletes performed on a specific table.
Use this application to quickly determine if the number of database transactions performed against a table are what you expect and to view all the tables accessed during the session.
SQL Summary application
Use the SQL Summary application step to view each unique database transaction activity that occurred during the monitoring session, the number of times the SQL statement was executed, and the average time it took to process.
Whereas the Parsed Session application can be filtered to show the total number of SQL statements, the SQL Summary application shows the total number of unique SQL statements.
Use the Explain Analyze row action to generate additional information about the query in the Explain Analyze Result field. For example, you can use this row action to view additional information about the indexes which were used to execute the query. If you notice that the index is auto-generated, you may be able to improve the performance of queries to the table by adding a new index.
Embeddings SQL Summary application
Use the Embeddings SQL Summary application step within the Application Monitoring Workbench application to examine the SQL statements that pertain to the Nextworld Intelligence semantic search utilities.
Logic Block Summary application
Use the Logic Block Summary application step to view each unique logic block that processed during the monitoring session, the number of times it was executed, and the average time it took to process.
Data Import Summary application
Use the Data Import Summary application step within the Application Monitoring Workbench application to review the performance of data import definitions.
For each run of a data import definition that you capture with application monitoring, the Data Import Summary application step displays two records that summarize the import. One record summarizes the processing activities for the import, and the other displays the activities resulting from the records being inserted into the tables. You can see how many records were imported, how long they took to process, and the average time to process and insert each record.
Call Stack application
Use the Call Stack application step to view the logic blocks that ran during your monitoring session in a hierarchy. When evaluating performance, the Call Stack application step is a useful starting point to narrow down the areas of your business logic that could be improved for performance.
The list form includes all parent logic blocks that were triggered as a direct result of a user interaction with the application as well as any background task logic blocks. These logic blocks represent distinct processes that may have happened simultaneously. Open the detail form to view all the logic blocks that were called by the parent logic block and its children. Expand the nodes manually, or use the Expand Node's Children row action to see all the logic blocks and their place in the process.
Use the Drill Down row action to view all the activities that occurred between that activity's start and end time. When you drill down in the Call Stack application, only activities that are a part of that Process are included. This means that drilling into two separate parent logic blocks displays two different sets of activities, even if they occurred simultaneously. The Drill Down - DB and Drill Down - LB row actions function in the same way, but also filter for database transaction or logic block activities, respectively.
Application monitoring best practices
These best practices ensure application monitoring sessions are performed consistently and efficiently throughout Nextworld.
Application monitoring has the potential to expose some sensitive data. Keep this in mind when performing an application monitoring session.
Keep application monitoring sessions as short as possible by only performing a single user action per session. Application monitoring creates large amounts of data, so this prevents unnecessary pressure on the database and ensures that the performance data you collect is useful to analyze.
Repeat monitoring sessions to verify that the performance data are consistent. A single session may take longer than expected due to external variables, but if the same activities are consistently slow across multiple sessions, it can indicate an issue or design flaw.
While you should keep the monitoring sessions themselves as short as possible, you should wait until all background tasks are complete to use the Generate Session Analysis row action in the Application Monitoring Utility application. This ensures that all relevant activities are included in the Application Monitoring Workbench application.