


.svg)


Reports are built over tables of data that have filters, groups, and other criteria applied to the records. The data source determines where to retrieve information from, and how to filter it before it is used in the report.
There are different types of reports that can be created, as detailed below.
Interactive Reports
Interactive reports are built over a single table, summary table, or data source defined in the Data Catalog application. Multiple report versions can be built over the same data source, each with their own filters, sorts, calculations, and visualizations.
Interactive reports are dynamic and enable users to drill down from the highest level of summary data into the most granular and detailed view of the same data. Learn more in the following topics:
- Ways to build an interactive report
When a data source is selected for an interactive report, the fields and business data from that table become available in the report. The type of data source selected determines if the available data is refined for your specific business process.
- Report versions in interactive reports
Report versions enable you to select different combinations of table layouts, filters, sorts, and visualizations to create multiple reports over the same data source. You can only view the different components in the interactive report if they have been added to a report version.
- Table layouts in interactive reports
Table layouts enable you to create Report Data and Row Details tables with the specific columns, groups, pivots, and aggregates that you want to organize your business data.
- Filter and sorts in interactive reports
Filters and sorts enable you to refine the data shown in your interactive reports, and organize it by ascending or descending values. Interactive reports can have default filters and sorts applied to different report versions.
- Calculated columns in interactive reports
Calculated columns display results of a calculation defined between two or more columns, or two or more values within the same column, in an interactive report.
- Report buckets in interactive reports
Report bucket definitions enable you to dynamically categorize records in interactive reports based on specified date ranges.
- Visualizations in interactive reports
Use visualizations to display data in a visual format, such as a graph or pie chart. Build visualizations in the Visualization Builder accessible from the Application Builder and Interactive Report Builder .
- Links in interactive reports
Links enable you to navigate to related applications, dashboards, or other interactive reports from the Report Viewer.
- Common context in interactive reports
Use common context to populate fields or filters in one application or interactive report based on a value published in another application or report. Or, use common context to create or select a record in an application link based on a published value.
- Advanced configurations for interactive reports
There are optional advanced configurations which you can use in your interactive reports. These configurations require application development experience and security access.
- Interactive reports performance considerations
This topic covers the best practices for improving performance in your interactive reports, and the guidelines for data volume.
- Interactive Reports best practices
These best practices ensure Interactive Reports are configured consistently.
Reports
Report templates and applications are built over a table or flat table to enable users to create reports. Learn more in the following topics:
- Report Builder
Application developers use Report Builder to design report templates with the layouts and data which they want included in them.
- Advanced report builder configurations
There are advanced configuration options that application developers can use for reports.
Reports
Reports are a type of document created from compiled data stored in tables.
A report data source table can be a standard table or a flat table. Learn more about flat tables in the Flat table reports topic.
All the data stored in the data source table becomes available in the Report Builder application. Report Builder is where you build a report template and the report structure. The template is an outline of which data items you want represented in the report, and the structure determines how the report and data looks when the report is generated by users. Learn more about Report Builder in the Report Builder section.
Application developers can create report templates and report version applications that allow business users to generate reports.
In order for users to run reports, you need to build a report table over the Report Builder template, and a Report Version application over the report table. The Report Version application is where users can define their criteria for what data they want reflected in a report.
The diagram below depicts the report building process using the following Nextworld objects:

 | Data source table—The standard or flat table with data that you want to be displayed in a report. This can be a new or existing table. |
|---|---|
 | Report Builder—Define basic information about the report and design a template for how you want data presented in the generated report. |
 | Report table—Create a table to build a report version application over. |
 | Report Version application—Build an application of type Report Version over the report inputs table, and specify the report. In this application, users can specify parameters and run the report. |
 | Report version—Business users can create multiple records in the report version application, each with different parameters. |
 | Report—Business users can run a report version record to view a finalized report. |
Report Builder
Application developers use Report Builder to design report templates with the layouts and data which they want included in them.
There are three panels used for configuration in Report Builder. Each panel serves a different purpose in configuration, as seen in the diagram below.
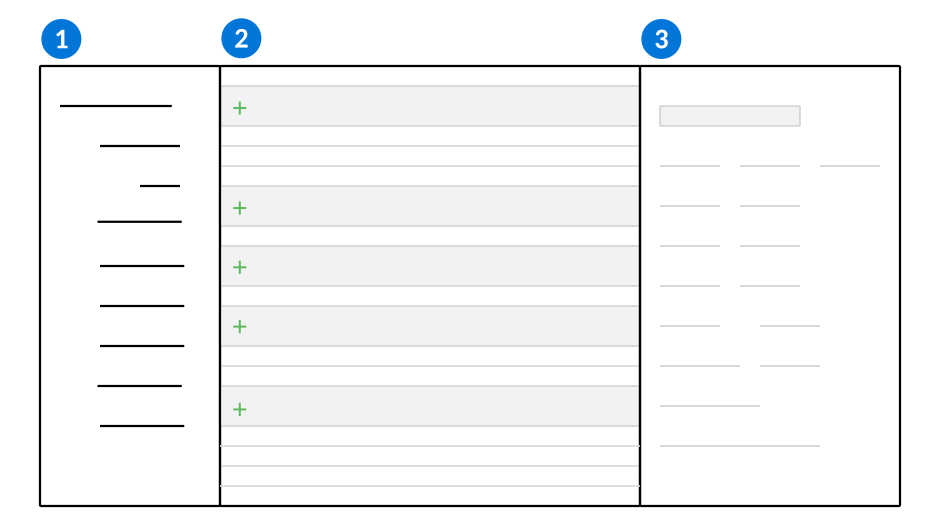
| Structure panel—View the list of data and inputs available to build and generate your report. Use the structure tree to add, remove, and reorder items within sections of the report. |
|---|---|
| Viewer panel—View a visual representation of the report where you can add, delete, reorder, or resize content items. Collapse the Viewer to hide the section labels of the report. This allows you to see what the report looks like without using the Preview button. Select the Add Group |
| Details panel—View and configure properties of the report. Select a content item from the Viewer panel, or a node from the Structures panel, to open the details. For example, if you select the Each content item in the report has an optional Export Column field in the Details panel. Add an export column value to reposition content items so that headers and footers can align with detail content items in the same column. The content item with the largest pixel width determines the size of the column in CSVs and Excel. |
To learn more about content item types, optional toggles, and action menu options, see the Report Builder configuration options topic.
Flat table reports
Flat tables are used specifically for reports, and are designed to use logic blocks to capture a copy of all necessary data for that report.
Use flat tables when you need to report on data from:
- Multiple tables, when you cannot access the necessary data by creating a new Join table
- Header Detail tables
- Continuous or transitional tables for cubes
These objects contain data from multiple sources that must be compressed into a single flat data source table in order to be used in reports.
The data for a flat table is populated by a logic block that queries a series of tables, applies filters based on report parameters, and inserts the retrieved data into the flat table. The logic block you create to retrieve data must be the same table that is used as the report table. After the logic block runs, you can create an application over the flat table to view and validate that the data that you want to be in the flat table was populated correctly. After you validate, you can use the flat table as the data source table in a report. Any time you run a report, the logic block fetches refreshed data and inserts it into the flat table so that data is always up-to-date and current when you run a report.
The diagram below depicts the report building process when you use data from a flat table data source:
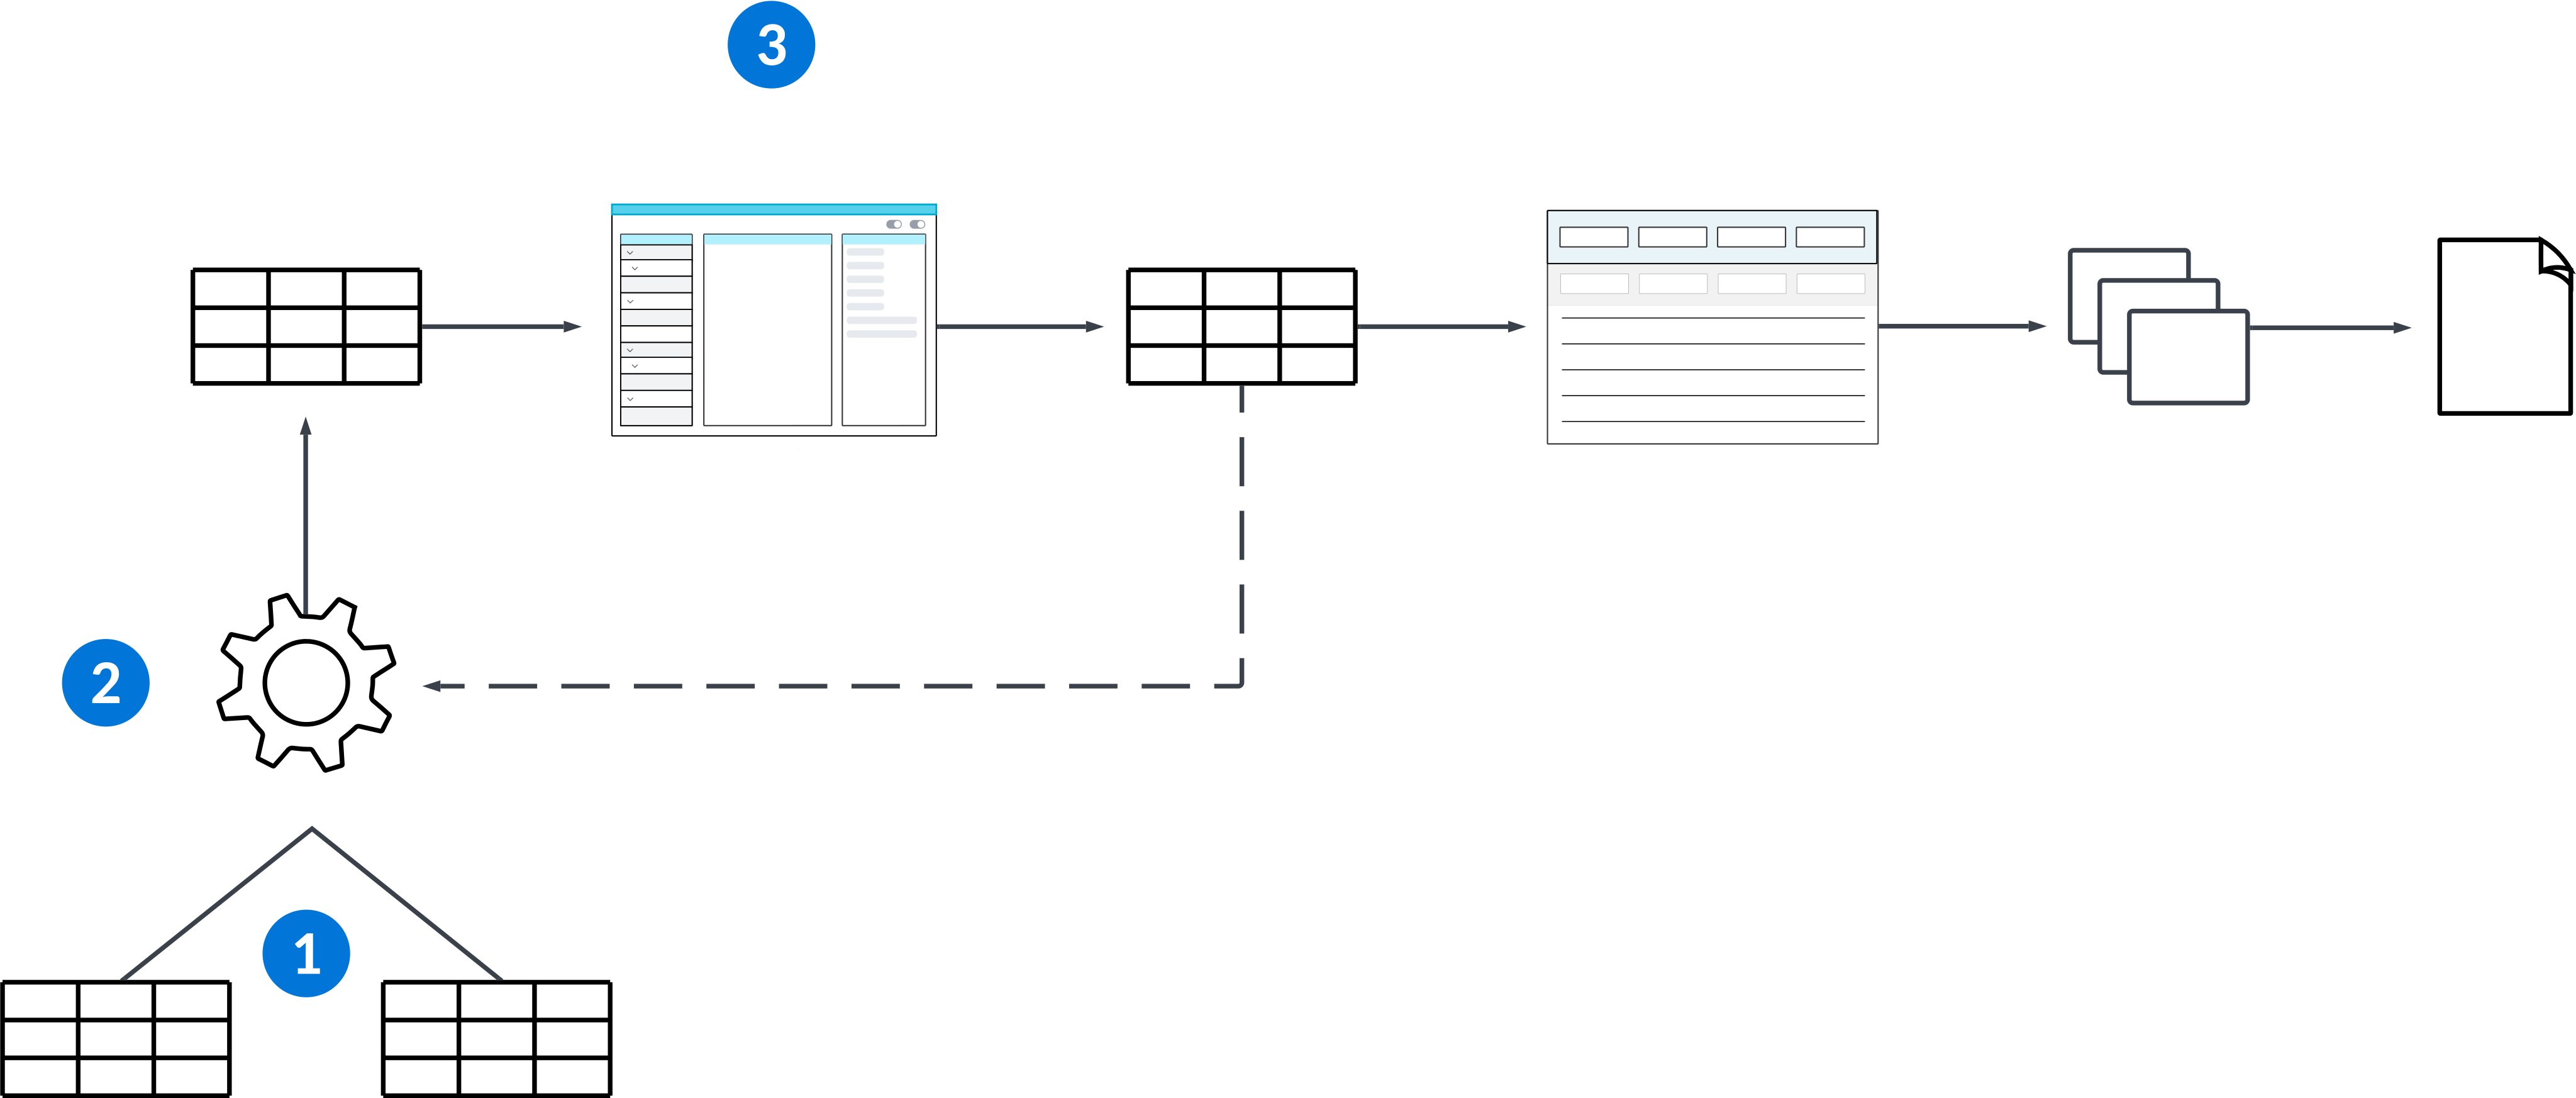
| Data sources—Tables that contain data you want to represent in a report. |
|---|---|
| Logic block—Build a logic block over the report version table that pulls in data from the data sources and deposits the data into a flat table. |
| Report Builder record—Create a record over the flat data source table in the Report Builder application with the basic information about the report. |
Learn more in Flat table report configuration and Reports.
Flat table report configuration
Configure a flat table report in the Table Definitions, Logic Block Builder, Report Builder, and Application Builder applications to build a report from data in a flat table and logic blocks.
Learn more in the Report naming conventions and standards topic to reference the naming conventions and standards when building flat reports.
Table—Report Version
The report version table can be created in the Table Definitions application, or in the Report Builder by selecting the Create Inputs Table form action located within the Actions menu. When configured via the Report Builder, the default inputs along with any additional inputs you added appear in the Fields page of the table.
The Report Version table is where you can pass parameters or inputs to the execution logic block. To configure a Report Version table in the Table Definitions application, you must:
- Create a new table of type
Main. - On the Fields page, add the
ReportAppConfigFieldsdata item group. - Add any additional data items that you want to act as field inputs for the logic block.
Table—Flat table
The Flat table contains copied data that can be used in a report. To create a Flat table in the Table Definitions application, you must:
- Create a new table of type
Main. - Use
FlatReportDataas the security group for the table. This security group restricts users so they can only access records created by them. - On the Settings page, select the Purge Active checkbox.
- Choose
Flat Report Datain the Purge Configuration Group field. This feature purges older data that is no longer relevant from the table to accommodate the up-to-date data that may be continuously inserted into this table. - Ensure that the Create Audit field is clear.
- On the Fields page, in the Fields subtable, add the following data items:
ReportExecutionIDReportVersion
- Select Required for the
ReportExecutionIDandReportVersiondata items. - Add any additional data items that you want available in the Report Builder. The values of these fields are inserted through the logic block.
Logic Blocks
In the Logic Block Builder application, you must:
- Create a new logic block over the Report Version table you created.
- Set the logic block to Public.
- Ensure that the Use NATE container checkbox is cleared.
- Configure the logic block that deposits data into the flat table as a
Background Taskin the Logic Block Type field. This ensures that the task does not time out if you are querying a large set of data. - Open the Logic Builder to create the logic block according to your requirements.
- Insert records into the flat table you created.
- Add
ReportExecutionIdandReportVersionto every record inserted into the flat table. - Define outputs based on the logic you wrote above.
- Add
Report Builder
In the Report Builder application, you must:
- Create a new report over the flat table you created.
- Specify the logic block you created above in the Report Data Logic Block field.
- Save the new report and refresh the list to see the new report record.
- Select the Report Builder form action to start creating a report template.
Report version application
Configure a Report Version application where users can run reports. In the Application Builder application, you must:
- Create an application of type
Report Version. - Use the inputs and available fields from the report version table to create filters for the users to narrow down their report parameters.
- On the Detail Form page, add the
ReportVersiondata item.
Debug flat table reports
Debug report issues, such as the data no displaying correctly when you run the report, by troubleshooting the table data and running a debug session for the logic block.
The steps below assume that:
You have a logic block and flat table attached to the report record.
You have a report version application built over the report record. The report version application is where users can execute the report.
To begin the setup for viewing flat data or debugging the logic block that flattens data, navigate to the base environment that you are developing in, as well as your personal lifecycle.
Troubleshoot flat data
If you run a report and the data does not group together as expected, or if the wrong data is shown, you can troubleshoot the data before you run a debug session. Troubleshooting the data allows you to check the data setup for problems or issues before checking the logic block. If troubleshooting the data reveals why the data is not displaying correctly, then you can make the change to the setup without having to run a debug session.
In the Application Builder application, you must:
- Create a new application of
Standardstyle, andStandardtype, over the same flat table defined in the report record. - Set the Display to
Primaryfor any fields from the flat table that contain data that you want to look at or validate. Do the same for theReportVersionandReportExecutionID. - Save, generate, and launch the application. You can view data in your lifecycle and the working environment where the report is usually run.
Set up a debug session
If the data setup is correct after you troubleshoot the flat data, the logic block may not be processing correctly. Before you start a debug session on the flattening logic block, you must set up the logic block in the UI so that a user action can run the logic block.
In the Application Builder application, you must:
- Filter for the report version application built over the report record.
- Check Out or Copy this application into your personal lifecycle.
- On the Actions page of the copied or checked out application, create a row action to run the flattening logic block.
- Save the copied report version application and generate your lifecycle version.
When the setup is complete, you can debug the flattening logic block in your lifecycle and the working environment where the report is usually run. In the copied, generated application, you can now select the Debug button and click the row action that runs the flattening logic block. Learn more about the logic block debugging process in the Run a logic block debug session section.
Report configuration
Application developers configure reports with the Report Builder application to create report templates. Then, they create report version applications that allow business users to generate reports using those templates.
Report Builder
In the Report Builder application, you must:
- Create a new record and specify the data source table. If the data in the table must be processed by a logic block, such as data in a flat table, specify the logic block in the Report Data Logic Block field. Learn more in Flat table reports.
- Save the record and select the Report Builder action to design your report template.
- Design your report template. Learn more in Report Builder.
- Use the Generate Application and Table action to create an inputs table with fields that reflect all the inputs specified in the report template, and to create a
Report Versionapplication over the inputs table.
Learn more in the Report naming conventions and standards topic to reference the naming conventions and standards when building reports.
Report Builder configuration options
Report Builder configuration options include content item types, referencing company logos, operations for interacting with the template, and action menu buttons that interact with the input table.
Content Item Types
Section items and content items are used in Report Builder to control areas of the report, and the data you want represented in those areas. The content item type determines where the content item gets its value.
| Type | Purpose |
|---|---|
| Box | Provides an easy way to draw a rectangle around other content in the selected section, when combined with the border options in the Styles section. |
| Constant | Allows you to specify a value for the selected content item. This value can never change. |
| Field | Displays the current value of a particular field from the report data source in the selected content item. |
| Formula | Performs basic mathematical functions using values from the report and displays the result as the selected content item's value. |
| Input | Uses a selected input as the value of the selected content item. |
| Label | Label a content item with either the field label, or short field label, from the specified data item's synonym. |
| Page Break | Ends the content for that page. Content after the page break starts on the following page. |
| Subreport | Displays the selected subreport in the content item. A subreport is another report called within this report. |
| System | Uses a special value for the selected content item, such as the current date or the current page number. |
Logos
Company logos can be used in reports. Associate a logo with the company record in the directory, and use Company as a table lookup field on the report table. Reference that field as a content item in order to show the company logo in the report.
Barcodes
Barcodes can be used in reports. Add a content item of type Field with a display of Field Value. Then, in the Styles section in the Barcode field, select the type of barcode you want in your report.
Toggles
There are several toggles in Report Builder that give you additional operations for interacting with your report template, such as:
- Show Preview toggle—View the report template you built as a PDF file with data pulled in from the data source table. A report version application must exist in order to use the preview option. If you have any additional data items that you have added as input values, they appear blank in the preview because these data items do not originate from the data source table.
- Mark as Draft toggle—Save a report template even though errors have been detected. In order to save outside of draft mode, you must resolve those errors. If there is a report version application built over the report template and you save the template in draft mode with errors, then reports in the report version application fail anywhere you are able to run them.
- Show Export Columns toggle—View the configured export column values in the Viewer panel. Each content item in the report has an optional Export Column field in the Details panel. Add an export column value to reposition content items so that headers and footers can align with detail content items in the same column. The number for each column appears next to the content item it is configured on when the toggle is selected.
Action Menu
There are several options in the Actions dropdown menu to help simplify creation of an input table, and creation of a report version application over the input table. The table below details several available actions.
| Actions | Purpose |
|---|---|
| Generate Application and Table | Creates and saves an inputs table. Once the inputs table is saved, a report version application is built and saved over the inputs table. The two new objects are automatically given the correct report naming standards. Learn more about the correct report naming standards in the Report naming conventions and standards topic. You remain in Report Builder while the two objects are created, and receive a notification when they are successfully saved. |
| Create Inputs Table | Takes you to the detail form of the Table Definitions application, and creates an inputs table for your report. Use this action to review the inputs table format before saving. The table is not automatically saved. |
| Edit Inputs Table | Takes you to the filtered list form of the Table Definitions application. Open the table record to update and edit the inputs table. |
| Edit Report Version Application | Takes you to the filtered list form of the Application Builder application. Open the application record to update and edit the report application. |
Report Builder application
Application developers use the Report Builder application to define their reports, and create report templates.
To create a report, specify the table that contains the business data you need to display in a report. If you build a report over a flat table, specify the associated logic block in the Report Data Logic Block field.
After you save your report, use the Report Builder action to design your report template. Learn more in Report Builder.
Learn more about creating and using reports in Reports.
Advanced report builder configurations
There are advanced configuration options that application developers can use for reports.
The following topics discuss the optional report configurations for reports:
- Composable reports
Application developers configure composable reports to include the output of multiple existing reports and attachments in the same PDF file.
- Email reports configuration
Configure emails to be sent automatically when a report is generated with the Message Event Definitions , Logic Block Builder , Message Template Setup , and Message Definitions applications. Successful report generations are included as a PDF attachment on the emails.
- Configure report bucket definitions
Application developers use the Report Bucket Definitions and Merge Text Template Setup applications to create bucket definitions. Bucket definitions allow users to dynamically categorize their records in interactive reports and report version applications.
- Report Execution History application
Use the Report Execution History application to review records for successful and failed report executions.
- Report Settings application
Adjust reports to fit your needs with the Report Settings application.
- Report layouts
System administrators use the Report Builder application to create alternate layouts for their reports. Business users can select these alternate layouts in report version applications.
- Configure application links in Report Builder
Configure a report with links to applications with the Report Builder application. This allows users to select links in the report output that open records that hold related information.
- Ways to include reports in application records
You can configure reports to be automatically attached or associated with application records.
- Export Excel/CSVs in Report Builder
Excel and CSV outputs are created by default when reports are generated. Configure the report information and columns you want included in the outputs in Report Builder.
- Group records in a report
Use the Add Group function in Report Builder to group and summarize report data in the report outputs. Configure report groups with values such as Company Name, GL Account number, or Ledger Name, to show summarized data in the rows of the report.
- Configure report layouts with customer defined attributes
System administrators configure report layouts to include their customer defined attributes (CDAs) using the Customer Defined Attribute Management and Report Builder applications.
- Subreports
Subreports are portions of one report, such as a subtable or check stub, placed inside of a different report.
Composable reports
Application developers configure composable reports to include the output of multiple existing reports and attachments in the same PDF file.
There are different combinations of reports and attachments you can include in a composable report, such as:
- A single report and attachments from different tables. For example, a work order report for maintenance on a machine and a PDF file of the machine's specifications.
- A collection of different reports. For example, a balance sheet report, an income statement report, and a trial balance report.
- Multiple iterations of the same report. For example, all unpaid invoice reports for a single customer.
Like normal reports, create and design composable reports in the Report Builder application. Then, create a Report Version application over the composable report so that users can run it.
When you define the report, you must:
- Specify
Composable Reportin the Report Type field. - Select a data source table that contains the records you need to run the report. You may need to create a flat table using a logic block to access all the data you need to run the composable report. Learn more in Flat table reports.
Then, use the Report Builder action to design your report. Instead of creating a detail section that includes fields from the data source table like you would for a normal report, specify composable parts. Composable parts can be either existing reports or attachments.
Report parts
Use a report part to run an existing report based on the records in the composable report's data source table or inputs table. All reports rely on inputs to generate a report output. Usually, these are values that a user enters into a report version application. This means that to run a report as a part of a composable report, you must specify how it receives those input values. Use the fields in your data source table or your inputs table to configure how each report part receives its inputs.
For example, to send a customer all their unpaid invoices, create a composable report and add an invoice report as a composable part. Specify the inputs necessary for the invoice report using fields from the composable report's data source table. If one of those inputs is the ReceivablesTransactionNumber field, configure the invoice report to run based on the value found in that field on the data source table. That is, for each data source record, the invoice report runs using the ReceivablesTransactionNumber value as an input. After all records in the data source table are processed, all relevant invoice reports are included in the same PDF file.
Attachment parts
Use an attachment part to include attachments on records in the composable report output. When you add an attachment part, specify a table, a filter, and a sort.
For example, you could include a PDF file of a machine’s specifications with the work order to repair the machine. To configure this, you must:
- Add an attachment part after the work order report part.
- Specify the table that contains the records that the specification PDF files are attached to.
- Configure the filters and sorts so that the specifications for the correct machine is included with the work order report.
When the composable report runs, the work order report is immediately followed by the machine specifications in the composable report output.
Email reports configuration
Configure emails to be sent automatically when a report is generated with the Message Event Definitions, Logic Block Builder, Message Template Setup, and Message Definitions applications. Successful report generations are included as a PDF attachment on the emails.
Configure report emails with the following applications:
- Message Event Definitions application—Define the event that triggers the message to be sent. Specify the table which you want to retrieve records from which can include addresses for your emails, or interpolated values for your message content. The report execution triggers the message event.
- Logic Block Builder application—Define the parameters for the Queue Report action. You can configure the event to be queued based on report success, or report failure.
- Message Template Setup application—Define the content for the messages. Reference the table from the message event to include interpolated values in your message content.
- Message Definitions application—Define the message template, message event, and associated configuration. Together, they create the automated messages and notifications which the system sends to recipients when the report is queued.
Message Event Definitions
In the Message Event Definitions application, create a message event and define the tables you want associated with your messages. This is most commonly the table the report version application is built over, but it could be any table that contains relevant information you want to reference in your message.
Logic Block Builder
In the Logic Block Builder application, configure a Queue Report action. In the details of the action, you must:
- Specify the report version application.
- Enter the name of the message event in either the Queue Message Event on Report Success, or Queue Message Event on Report Failure section.
If the logic is configured on Report Success, the PDF is automatically included in the configured messages if the report successfully generates.
For Report Failure, only the message from the message template is included.
Message Template Setup and Message Definitions
In the Messages Template Setup application, create your message and designate the recipients. You can optionally include interpolated values from a table your message event is built over.
Once your message event, logic block, and message template have been configured, reference them in a message definition. There are additional configuration options available for messages. Learn more in the Message configuration topic.
Configure report bucket definitions
Application developers use the Report Bucket Definitions and Merge Text Template Setup applications to create bucket definitions. Bucket definitions allow users to dynamically categorize their records in interactive reports and report version applications.
Report Bucket Definitions
Configure your bucket definitions in the Report Bucket Definitions application. The Bucket Name is the unique identifier which allows you to select which bucket to reference when running a bucketed report.
Each report bucket definition is configured with columns that sort the records into categories based on the bucket type. There are several bucket types to select from, such as:
Relative Date—The records in the report are organized based on date ranges which are relative to a specific date.Relative Period—The records in the report are organized based on date ranges which are relative to a specific period within a fiscal year.
The bucket type selected determines which fields populate in the form for configuration.
The Bucket Columns subtable dictates the date ranges for each column in the report. The bucket columns subtable is different depending on which bucket type is selected. For example, with a bucket type of Relative Date, the subtable is the BucketByRelativeDateSubtable. You can find the name of the subtable by selecting the help text icon. The data item name is found along the bottom of the help text box. See the Report bucket example topic for more information.
Merge Text Template Setup
Create the labels for your columns in the Merge Text Template Setup application. There are several considerations during configuration, such as:
- The Template Type should be either
TextorText Area. - The Template should be formatted with a structure of ${FieldName} and whatever additional criteria you want. For example, ${BucketRelativeDateLow}+ Days or ${BucketRelativeDateLow} - ${BucketRelativeDateHigh} Days
- In the Input Type Hints subtable, define each variable you included in the template. This allows the report bucket definition to identify the column header templates.
- The MergeTextTemplateTypeHints.MergeTextTemplateTypeHintInput can be any field from the Bucket Column subtable in the Report Bucket Definition application. To view all of the available field options, open the
BucketByRelativeDateSubtableandBucketByRelativePeriodSubtablesubtables in the Table Definitions application.
- The MergeTextTemplateTypeHints.MergeTextTemplateTypeHintInput can be any field from the Bucket Column subtable in the Report Bucket Definition application. To view all of the available field options, open the
For example, the BucketActualDateHigh field isn't visible in the Report Bucket Definitions application, but it is in the Bucket Column subtable. Select this field in the merge text template to create a column label that uses the highest date found within the column date range. If your column dates are 01/03/2022-01/09/2022, the column label for a merge text template configured as Week Ending ${BucketActualDateHigh} would be Week Ending 01/09/2022.
Report bucket example
This is a hypothetical example of how report bucket definitions can help you categorize your report data based on specified date ranges.
The bucket type determines which input and date fields are available for configuration. The Bucket Column subtable fields determine the date ranges for each column. There are several fields to consider in the subtable, such as:
- Lower range bound—Dictates the lowest date range in that column, such as the relative date (low) or relative period (low).
- Higher range bound—Dictates the highest date for the date range in that column, such as the relative date (high) or relative period (high).
- Label—Dictates what the column is labelled.
Relative Date
For report bucket definitions with a bucket type of Relative Date selected, there are several fields to consider, such as:
- Time Unit—Dictates whether the values in BucketByRelativeDateSubtable.BucketRelativeDateLow and BucketByRelativeDateSubtable.BucketRelativeDateHigh are counting in day or week increments.
- Start Date Input—Dictates the date which the BucketByRelativeDateSubtable.BucketRelativeDateLow and BucketByRelativeDateSubtable.BucketRelativeDateHigh are dependent on. The start input date specifies a report parameter name from the report version application.
- Date Field—Dictates which field from the record is checked by the bucket definition to determine if the record falls within the selected date range.
The table below shows how different values would impact the date ranges for each column with a bucket type of Relative Date.
| With a Time Unit of... | With a Start Date Input of... | With a BucketByRelativeDateSubtable.BucketRelativeDateLow of... | With a BucketByRelativeDateSubtable.BucketRelativeDateHigh of... | The column shows any records that fall into the date range of... |
| Days | April 1, 2022 | 0 | 0 | April 1, 2022 |
| Days | April 1, 2022 | -10 | 10 | March 22, 2022 - April 11, 2022 |
| Days (Invert Time Units checkbox selected) | April 1, 2022 | 0 | 7 | March 24, 2022 - April 1, 2022 |
| Weeks | April 1, 2022 | 0 | 0 | April 1, 2022 - April 7, 2022 |
| Weeks | April 1, 2022 | 0 | 2 | April 1, 2022 - April 21, 2022 |
| Weeks (Invert Time Units checkbox selected) | April 1, 2022 | 0 | 1 | March 19, 2022 - April 1, 2022 |
Relative Period
For report bucket definitions with a bucket type of Relative Period selected, there are several fields to consider, such as:
- Starting Period Input—Dictates the period within the fiscal year which the Relative Period (Low) and Relative Period (High) are dependent on.
- Starting Fiscal Year Input—Dictates the fiscal year for the starting period input.
- Period Data Field—Dictates which field from the record is checked by the bucket definition to determine if the record falls within the selected period.
- Fiscal Year Data Field—Dictates which field from the record is checked by the bucket definition to determine if the record falls within the selected fiscal year.
- Aggregate Adjustment Period Input—Dictates if there is an adjustment period for the company's fiscal year which should be included in the report.
The table below shows how different values would impact the date ranges for each column with a bucket type of Relative Period in a standard 12 period year fiscal calendar with period 13 as an adjustment period.
| With a Starting Fiscal Year Input of... | With a Starting Period Input of... | With a Relative Period (Low) of... | With a Relative Period (High) of... | The column shows any records that fall into the date range of... |
| 2020 (no adjustment period) | 5 | 0 | 0 | Fiscal Year 2020, Period 5 |
| 2020 (no adjustment period) | 1 | -1 | 2 | Fiscal Year 2019, Period 12 - Fiscal Year 2020, Period 3 |
| 2020 (with adjustment period) | 2 | -2 | 4 | Fiscal Year 2019, Period 13 - Fiscal Year 2020, Period 6 |
| 2020 (with adjustment period) | 1 | -1 | 0 | Fiscal Year 2019, Period 13 - Fiscal Year 2020, Period 1 |
Enable bucket definitions for report version applications
Application developers use report bucket definitions in interactive reports and report version applications to group records into columns based on defined categories, such as date ranges.
Report Builder
To allow users to select bucket definitions for use in their report version applications, you must first configure them in Report Builder. There are several sections in Report Builder which bucket definitions can be used in, such as the Header, Group Header, Footer, Group Footer, and Report Summary. Only one column needs to be set up for a bucket definition in Report Builder. Each content item in that column must have the bucket definition selected in the Bucket Definition field. Once that column is configured, the system duplicates the configuration information at runtime, such as the width and height, for each column found in that report bucket definition's subtable.
When a bucket definition is selected in Report Builder, additional options for Display Fields are available, such as:
Bucket Field Value—Indicates that the individual field values show beneath the bucket definition columns that their records fall into. If a record does not fit into a bucket definition column, it prints on the report as a value of zero.Bucket Subtotal—Indicates that each column should have a subtotal of all the records listed in the bucket definition.Bucket Total—Indicates there should be a total for all of the records included in the bucket definition.Bucket Running Total—Indicates there should be a running total for each consecutive group in the report. The running total looks at the upper bound in the range defined in the bucket subtable, so any record that falls within that range in the bucket definition is included. The value for each date range column is added to the previous date range columns found in the table.
After you configure a bucket definition in Report Builder, you can enable the Bucket Definition field in report version applications. The field is a text table lookup report input where users can specify the actual bucket definition at runtime in their report version applications.
Learn more about Report Builder in the Report Builder topic.
Nextworld delivers already configured report bucket definitions, but you can also create your own in the Report Bucket Definition application.
See the Report bucket example and Configure report bucket definitions topics.
Merge Text Template Setup application
Application developers use the Merge Text Template Setup application to create concatenated header values for report bucket definitions.
Report buckets dynamically categorize records in their reports based on date ranges organized into column. The column headers must be configured with a merge text template record to show the correct value at report runtime.
For example, the BucketActualDateHigh field isn't visible in the Report Bucket Definitions application, but it is in the Bucket Column subtable. Configure this field in the merge text template to create a column label that uses the highest date found within the column date range. If your column dates are 01/03/2022-01/09/2022, the column label for a merge text template configured as Week Ending ${BucketActualDateHigh} would be Week Ending 01/09/2022.
To configure:
- The Template Type should be either
TextorText Area. - The Template should be formatted with a structure of ${FieldName} and whatever additional criteria you want. For example, ${BucketRelativeDateLow}+ Days or ${BucketRelativeDateLow} - ${BucketRelativeDateHigh} Days
- In the Input Type Hints subtable, define each variable you included in the template. This allows the report bucket definition to identify the column header templates.
- The MergeTextTemplateTypeHints.MergeTextTemplateTypeHintInput can be any field from the Bucket Column subtable in the Report Bucket Definition application. To view all of the available field options, open the
BucketByRelativeDateSubtableandBucketByRelativePeriodSubtablesubtables in the Table Definitions application.
- The MergeTextTemplateTypeHints.MergeTextTemplateTypeHintInput can be any field from the Bucket Column subtable in the Report Bucket Definition application. To view all of the available field options, open the
Learn more in Configure report bucket definitions.
Report Bucket Definition application
Application developers and users use the Report Bucket Definition application to create or modify bucket definitions.
Report bucket definitions allows users to dynamically categorize records in their reports based on date ranges in individual columns. Date ranges can be configured in several formats, such as days, weeks, or fiscal periods.
Learn more in the Report bucket example and Configure report bucket definitions.
Report Execution History application
Use the Report Execution History application to review records for successful and failed report executions.
Each record contains information about a report execution, such as the report parameters, output files, and error messages if the execution failed. Only user initiated executions are traced within the application.
Execution Inputs page
Review information about the execution attempt, such as the status, report version, and the user who ran the report.
Execution Variables page
Review additional details about the report which was executed, such as associated logic blocks and security settings.
Errors page
Review any error messages populated during execution.
Output page
Review the report output, including the attachment and a preview of the data.
Report Settings application
Adjust reports to fit your needs with the Report Settings application.
Report settings override aspects of existing reports. You can create and apply report settings to change the format of currency items, apply watermarks, and more.
Create report settings in the Report Settings application. There are different types of report settings, including:
- Default report settings—Apply automatically to every report version created from the specified report. Reports can only have one default report setting. To create a default report setting, specify a report in the Default Report Name field in the Report Settings application.
- Report version settings—Apply to an individual report version only.
If you apply a report version setting to a report that has a default report setting, both settings apply. However, if there are conflicts between the settings, the report version setting overrides any conflicting values.
For example, a report may have a default report setting that applies your company name as a watermark and sets the ReportPaperSize to Letter (8.5 x 11in) 215.9 x 279.4mm. You create a report version and apply a report version setting that does not specify a watermark, but displays currency values without currency codes and sets the ReportPaperSize to A4 (8.25 x 11.75in) 210 x 297mm. When you run the report, it has the company watermark, displays no currency symbols, and has a ReportPaperSize of A4 (8.25 x 11.75in) 210 x 297mm.
Report layouts
System administrators use the Report Builder application to create alternate layouts for their reports. Business users can select these alternate layouts in report version applications.
A report layout has the same components as its parent report, but with an alternate template design created in Report Builder. When a business user creates new versions of a report in a report version application, they can select an alternate report layout as an input.
For example, you may need to adjust the position of the signature line on a check based on the format required by a bank. You could create a report layout over the existing check report and move the signature line to the correct position. When business users access the report version application to run their check report, they can create a new report version and specify the report layout. When they run the report, the signature line on the check is in the correct position.
Report layouts are records in the Report Builder application. Create report layouts with the Create Alternate Layout row action on the report you need an alternate layout for. After you save the report layout record, you can open it in Report Builder and adjust the design of the report template. Learn more about designing report templates in Report Builder.
Configure application links in Report Builder
Configure a report with links to applications with the Report Builder application. This allows users to select links in the report output that open records that hold related information.
In the Report Builder application, you must:
- In the Structure panel, select the Application Links section.
- In the Detail panel, configure application links in the subtable. You can select the application, application settings, and form you want to open. This is most often the list form.
- Select the Edit Mappings button to open the Data Mapper. Map the report values as the source, and the application you're linking to as the destination. Make sure everything you want mapped when you create the application link is configured. See the Data mapper topic for more information.
- Select the content item which you want to display as a link in the report output. You can select content items in either the Structure or Viewer panel.
- In the Editor panel, use the Application Link field to select the application link to use. This can be the application link you just configured.
Ways to include reports in application records
You can configure reports to be automatically attached or associated with application records.
Options include:
- Configure an application link to navigate to a report version from the application record. Optionally, data map specific fields to provide change the functionality.
- Attach a report version record to the application record. Use the inline attachment viewer to view the attached report.
- Use the Queue Report action to run a designated report version application in the background. Send the report output to a desired location, such as an application record or a centralized table.
Navigate to a report version with an application link
If you would like an application link to run a report automatically then it must meet the following criteria. On the Actions page in the Application Builder application, you must:
- Add a new application link to the Application Links subtable.
- Name the application link and define the report version application that the link should open to.
- Choose
Containerin the Form field. - Choose
Containeras the Destination Region for all your data mappings. - Add an additional field mapping into a value that doesn't exist in any report versions. For example, map a constant such as
NonExistentVersioninto one of your report inputs.
If you don't want your application link to run a report automatically, configure your data mappings to match an existing report version.
You can data map the following fields to achieve different functionality in your application link:
ReportDisplay—Control what type of file the report is formatted in. For example, PDF.ReportAttachmentRecordId,ReportAttachmentNameReportAttachmentTableReportAttachmentRegenerate—If you provide the ReportAttachmentRecordId, ReportAttachmentName, and ReportAttachmentTable parameters and leave this cleared, the previously generated report is attached. If you select this, a new report is generated and overwrites the previous record.
Export Excel/CSVs in Report Builder
Excel and CSV outputs are created by default when reports are generated. Configure the report information and columns you want included in the outputs in Report Builder.
All report outputs, such as Excel, PDF, CSVs, and Word, are created by default when reports are generated. If you don't want all output formats included, select Report in the Structures panel. The Output Formats field on the Detail panel allows you to select which outputs you want created when the report is generated. If a value is selected, the rest of the outputs are excluded. If none are selected, all the report outputs are created when the report generates.
Column Configuration
Each content item in the report has an optional Export Column field in the Details panel. Add an export column value to reposition content items so that headers and footers can align with detail content items in the same column. The content item with the largest pixel width determines the size of the column in CSVs and Excel.
Select the Exclude From Excel Output checkbox if the content item should not be included in the output. This can be selected in individual content items, or from a section level if all content items in that section should be excluded.
Select the Show Export Columns toggle in the Report Builder to show the configured export column values in the Viewer panel. The number for each column appears next to the content item it is configured on.
Once the report is generated, the outputs are accessible from the Report Executions application.
Group records in a report
Use the Add Group function in Report Builder to group and summarize report data in the report outputs. Configure report groups with values such as Company Name, GL Account number, or Ledger Name, to show summarized data in the rows of the report.
You can select one, or many, values to group by. For example, if you grouped by Company and GL Account 1, and both Company A, and Company C have records associated with that GL account. All of the records for Company A in GL Account 1 would be summarized in one row, and all of the records for Company C in GL Account 1 would be summarized in a second row. See the Group report records example topic for more information.
Column headers for each Group Header are created in the report. The Group Header section shows the first record in the dataset that matches the Group By criteria and content items selected.
Group Footers are created when a Group Header is configured. Use Group Footers to show aggregated and summarized data for all the of rows included in the output.
See the Group report records configuration topic for more information.
Group report records example
This topic shows a hypothetical example of how Group By configurations can be used in Report Builder.
The group headers are prioritized based on the order which they are listed in the report template.
Group Header 1: GL Account 1
Group Header 2: GL Account 2
Group Header 3: Org Unit
| Fiscal Year 2022, Period 1 | Fiscal Year 2020, Period 3 | ||
| GL Account 1 | |||
| Org Unit 1 | Summarized data for all records for Org Unit 1, in GL Account 1, in Fiscal Year 2022, Period 1 | Summarized data for all records for Org Unit 1, in GL Account 1, in Fiscal Year 2020, Period 3 | |
| Org Unit 2 | Summarized data for all records for Org Unit 1, in GL Account 2, in Fiscal Year 2022, Period 1 | Summarized data for all records for Org Unit 2, in GL Account 1, in Fiscal Year 2020, Period 3 | |
| Org Unit 3 | Summarized data for all records for Org Unit 1, in GL Account 3, in Fiscal Year 2022, Period 1 | Summarized data for all records for Org Unit 3, in GL Account 1, in Fiscal Year 2020, Period 3 | |
| Group Footer | Total summarized data for all Org Units, in GL Account 1, in Fiscal Year 2022, Period 1 | Total summarized data for all Org Units, in GL Account 1, in Fiscal Year 2020, Period 3 | |
| GL Account 2 | |||
| Org Unit 1 | Summarized data for all records for Org Unit 1, in GL Account 2, in Fiscal Year 2022, Period 1 | Summarized data for all records for Org Unit 1, in GL Account 1, in Fiscal Year 2020, Period 3 | |
| Org Unit 2 | Summarized data for all records for Org Unit 2, in GL Account 2, in Fiscal Year 2022, Period 1 | Summarized data for all records for Org Unit 1, in GL Account 1, in Fiscal Year 2020, Period 3 | |
| Org Unit 3 | Summarized data for all records for Org Unit 3, in GL Account 2, in Fiscal Year 2022, Period 1 | Summarized data for all records for Org Unit 1, in GL Account 1, in Fiscal Year 2020, Period 3 | |
| Group Footer | Total summarized data for all Org Units, in GL Account 2, in Fiscal Year 2022, Period 1 | Total summarized data for all Org Units, in GL Account 1, in Fiscal Year 2020, Period 3 | |
Group report records configuration
Configure the Group By feature in reports with the Report Builder application.
Prerequisite
In the Report Builder application, open the report you want to configure. In the Structure panel, select Sort and configure the sorts you want used in the report template. You can select which value you want to sort by, and how you want to sort it. For example, Sort Ascending and Company Name.
Group Header and Group Footer
To configure Group Headers and Group Footers in Report Builder:
- In the Viewer panel, on the Detail section, select the Add Group
 button to create a Group Header and Group Footer.
 - In the Viewer panel, select the Group Header section you created. In the Details panel, select the value or values you want to group by. For example,
Company Name. - Optionally, select a Dynamic Indent Field value to control the depth of indent you want used for that group. For example, you may want each Group Header indented at a different depth.
- Configure the Group Footer section you created. Optionally, select a Display field value, such as
Subtotal,Aggregation,Minimum, orMaximum. If you are using Dynamic Indent Fields in the Group Header, select the Dynamic Indent checkbox in the Group Footer.
Multi-currency groups in reports
Group multi-currency records in reports by configuring sorts and groups in Report Builder. By grouping by currency code, records are more organized in a report, and make it easier to perform calculations for groups of records with the same currency code.
Group records by currency code
First, add a sort to order the records by their currency code. Then configure a multi-currency group within a group header by selecting a currency field for the records to be grouped by. When the field you are using to group by is a currency field, Nextworld automatically groups records by their currency code.
For example, if your driver table contains currency records with both United States Dollar (USD) and Canadian Dollar (CAD) currency codes, sort records by their currency code and configure a multi-currency group. In the report output, one group displays USD records and another group displays CAD records.
Multi-currency calculations
You can only preform calculations with currency records that have the same currency code. If you try to configure a currency formula in a report with records that have different currency codes, the formula field is left blank in the report output. Instead, configure formulas within the Group Footer or Detail sections to see accurate calculations of currency records for each group in the report output.
Configure report layouts with customer defined attributes
System administrators configure report layouts to include their customer defined attributes (CDAs) using the Customer Defined Attribute Management and Report Builder applications.
Customer Defined Attribute Management application
In the Customer Defined Attribute Management application, you must:
- Configure a type CDA profile.
- In the Configure Reports application step, select Activate for Report checkbox on the report you want to include your CDAs.
- In the Activations application step, Activate the configuration.
Report Builder
In the Report Builder application, you must:
- Use the Create Alternate Layout action on the report you want to display your CDAs. Learn more in Report layouts.
- Open the new report layout and add your CDAs as content items. Users can select this new report layout in their Report Version applications.
Subreports
Subreports are portions of one report, such as a subtable or check stub, placed inside of a different report.
Subreports are added to other reports in the Report Builder application. You can select the location for the subreport, as well as the inputs you want passed from the report template to the subreport. For example, you may want to pass inputs for the Company name and Org Unit so that the subreport only shows data relevant to whichever Company you are viewing in the main report. This allows you to see different sets of data in the subreport depending on what record is being viewed in the main report.
Learn more in Configure subreports in Report Builder.
Configure subreports in Report Builder
Configure subreports in Report Builder to reference a report template inside of another report template.
Prerequisites
You must already have a record created in the Report Builder application for the report you want included as a subreport.
Report Builder
In the Report Builder application, you must:
- Select the section of the template you want the subreport to populate in, and add a new Content Item.
- In the Details panel, select
Subreportin the Type field. - Enter the name of the report template you want to reference.
- Select the Inputs from the report template that you want passed into your subreport.
Configuration considerations
- You can configure a subreport inside another subreports. Additional levels of nested subreports are not permitted.
- There is no limitation on the amount of subreports you can add into a report, though performance will decrease.
- Subreports do not need to be configured with page margins.
- The size of the subreport is dependent on the page size and content height. Subreports expand to the size of the output they create.
Learn more in Subreports.
Reporting and analytics best practices
These best practices ensure that reports are configured consistently throughout Nextworld.
- Reports best practices
These best practices ensure that reports are built consistently throughout Nextworld.
- Interactive Reports best practices
These best practices ensure Interactive Reports are configured consistently.
Reports best practices
These best practices ensure that reports are built consistently throughout Nextworld.
Reports are built with the Report Builder application.
General
Throughout the report, follow these Nextworld text best practices:
| Field | Value |
|---|---|
| Report Font | Plex Sans |
| Font Size | 12px or 10px |
| Text Color | Black—RGBA(0, 0, 0, 1) or Hex (#000000) |
The content labels you use should come from data item labels instead of constants. If someone changes the label of a synonym, it appears across applications and reports consistently.
The height and width of the report must align with dimensions for letter or legal paper format dimensions.
Do not create colon (:) content labels. For example, if you may have the label Supplier and the label ABC Supplier in a report. Do not link the labels with a constant (:) content label to create Supplier : ABC Supplier.
Always apply a sort in Report Builder if you want records in the report output to display in a particular order. If you are expecting data to be returned from a table in the order that it was added by a logic block, apply a sort in Report Builder on the nwCreatedDate field.
Report Title
Repeat the header on each page. To create pixel perfect reports, or reports in which you can control every component of the report down to the pixel level, the header must not repeat.
The report title must be Bold and follow the standards of the other report parameters in Report Title such as company, fiscal year, period, as-of date, etc for a financial report. These standards are:
| Field | Value |
|---|---|
| Style | Horizontal Align Center, Vertical Align Bottom |
| Font Size | 16px |
Column field labels
Place column field labels in the Detail section under Sections. Column field labels must follow these standards:
| Field | Value |
|---|---|
| Style | Bold, Horizontal Align Center, Vertical Align Bottom |
| Border Bottom | Size 2, Solid |
| Border Top | Size 2, Solid |
Group Header fields
| Field | Value |
|---|---|
| Style | Bold, Horizontal Align Left |
Totals
Sub totals and grand totals in a report must be added to the Group Footer section. Sub total text must have a Style of Horizontal Align Left. Sub total numbers and amounts must be aligned under their appropriate column.
Line Separators
Line separators between rows and sub totals must be placed in the Detail or Group sections. Use separate lines if your detail line layers multiple fields or if you have a group total. If your detail line fields are only on one row, then do not use line a separator.
| Field | Value |
|---|---|
| Border Bottom | Size 1, Solid |
Data Items
| Data item type | Style |
|---|---|
| Currency | Horizontal Align Right |
| Date | Horizontal Align Center |
| Number | Horizontal Align Right |
Page Footer and Last Page Footer
Both the Page Footer and the Last Page Footer sections must contain the information on when the report was run and display the report page numbers.
The data item you use to display when the report was last run must be configured according to the following:
| Field | Value |
|---|---|
| Type | System |
| System | Current Date and Time or Current Date |
| Style | Horizontal Align Left |
The data item you use to display the report page numbers must be configured according to the following:
| Field | Value |
|---|---|
| Type | System |
| System | Page Number or Page Number of Count |
| Style | Horizontal Align Right |
No Data
By default, if no data is found when a report runs, Nextworld displays a default message. Select the Use Custom No Data check box if you want to display specific content instead of the default.
Watermark
If you use a watermark in your report, you must use either a System or Input Type.
Indexes
Add a unique index to your report table that contains the ReportVersion data item. This prevents users from creating multiple versions of a report with the same Report Version value and ensures that jobs that run the report run the intended version.
When you apply a sort in Report Builder, add indexes for the fields you are sorting with to improve performance.
When building a report over a flat table, create a primary index on the table for the ReportExecutionID data item. This improves performance. You should also ensure that the Use NATE container checkbox is cleared on your logic block that flattens the data.
Report application standards
Build a Report Version application over a Report Builder record. The Report Version application is the tool that end users use to input their specific parameters for the report.
Configure these standards in the Application Builder application for a report type application.
Pages and Rows
You must define at least two rows to be used in the detail form. You can add more rows depending on the specific report version application requirements. Only use pages if multiple pages are necessary.
The different rows must be configured as such in the Rows subtable:
| Field | Top row | Second row | Subsequent rows |
|---|---|---|---|
| Title | No title | Report Parameters | No title |
| Collapsible | False | False | False |
| Hide Row Separator | True | False | False |
List Form Fields
The list form of a report version application is only displayed if the report version application is immediately accessed through the list view. If the report version application opens directly to the detail form, users cannot access the list form.
The order of the list form Primary fields must always begin with ReportVersion. If it is displayed in the detail form, then ReportTitle should be the next Primary field visible.
The list form Primary fields should follow this order of precedence:
ReportVersionReportTitleReportLayout- Date and DateTime fields
OrganizationalUnit- Additional parameter fields (these must not be Date, DateTime or True False fields)
- True False fields
After you include the above, you must also include the ReportDisplay field as Available-Hidden.
Detail Form Fields
The top row should only contain the following fields in the Detail Form Fields page:
ReportDisplayReportVersionReportTitleReportLayout
The second row must contain selection criteria specific to the type of report. For example, the second row could contain work order selection criteria or item ledger summary selection criteria.
Report naming conventions and standards
These naming standards ensure that reports across Nextworld follow the same conventions so that application developers can easily identify and classify them.
Do not use the word Report in the report name because it is added on to the table and application names. Format the report objects according to the conventions listed below:
| Nextworld object | Naming convention | Example |
|---|---|---|
| Report | <Report name> | SalesOrder |
| Sub Report | <Report name><Sub report>Subreport | SalesOrderSubreport or WOTravelerOperationsSubreport |
| Report table | <Report name>Report | SalesOrderReport |
| Report version application | <Report name>Report | SalesOrderReport |
Flat tables
When you are building a report over a flat table, you must create some additional objects to the standard report building process that is mentioned above. Format the flat report objects according to the conventions listed below:
| Nextworld object | Naming convention | Example |
|---|---|---|
| Flat table | <Report name>Flat <Report name><Subreport>Flat | SalesOrderFlat WOTravelerOperationsFlat |
| Logic block | <Flat table name>Execution | SalesOrderFlatExecution |
Interactive Reports best practices
These best practices ensure Interactive Reports are configured consistently.
There are several considerations when you create interactive reports, such as:
- Interactive reports should always be built over View tables.
Interactive Report Builder
Use the Interactive Report Builder application to dynamically view your business data with features such as pivot, group by, and visualizations. Interactive reports enable you to drill down from the highest level of summary data into the most granular and detailed view of the same data.
Select a table to build your interactive report over, or use the Select a Data Source  button to pick a source from the Data Catalog application. The data catalog provides previously configured data sources that are specific to different business domains. You can add new entries to the catalog, or customize an existing source.
The components of the Interactive Report Builder change depending on what feature you are configuring for the report. The diagram below shows the different panels when you are configuring a Table Layout.
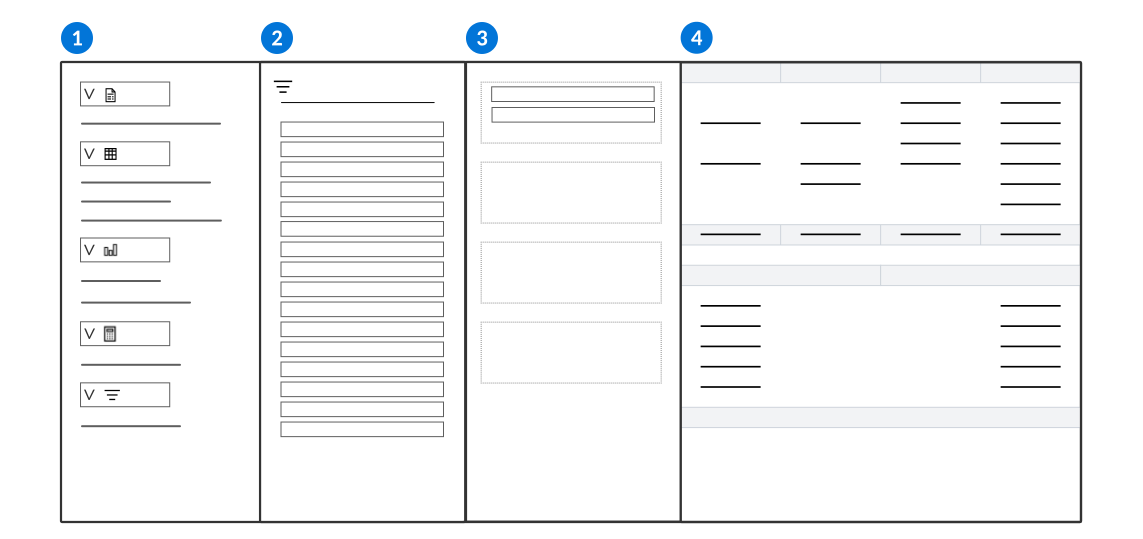
| Build and select features for the report. Each section allows you to access different options, such as:
|
|---|---|
| Contains fields from your data source which you can use to build your reports. Use the Add Field  button or drag the fields you want to use in aggregates, pivots, columns, and groups. For table lookup fields, expand the field to see the available values, or select the button or drag the fields you want to use in aggregates, pivots, columns, and groups. For table lookup fields, expand the field to see the available values, or select the  icon to view available hierarchies. icon to view available hierarchies. |
| Contains the configuration options for your report. Drag and drop fields into the different report options to update the Report Data table. This panel is only available when configuring a Table Layout. |
| Changes depending on which report structure is selected. For example, when the Table Layout section is open you can see the business data from your data source organized into rows and columns, and you can create pivots and groups to categorize and aggregate your data in different ways. When the Visualizations section is open, you can see a visual representation of your business data based on the fields you select. |
Ways to build an interactive report
When a data source is selected for an interactive report, the fields and business data from that table become available in the report. The type of data source selected determines if the available data is refined for your specific business process.
There are multiple ways you can create interactive reports over different shapes of data, such as:
- Select an entry from the data catalog.
- Use the Report Quick Start button in an application.
- Enter the name of a table.
Data Catalog
Building an interactive report over a data catalog entry is the most streamlined and easy way for you to create reports. Catalog entries are sorted into Groups, and Sub-Groups, which helps you select the correct data source at the time of report creation.
For example, there are existing data catalog Groups for Distribution and Financials. In the Distribution group, there are Sub-Groups for Inventory and Procurement. In the Financials group, there are Sub-Groups for General Accounting, Payables, and Receivables.
In the Distribution Group, Inventory Sub-Group, you can select catalog entries for business uses like Item Ledger Transactions (All item ledger transactions). In the Financials Group, Payables Sub-Group, you can select catalog entries for business uses like AP Payments (Supplier Payments). The Item Ledger Transactions data catalog entry is built over a view table which refines the available fields to only those that are useful for that type of interactive report. The AP Payment data catalog entry is built over a table which combines the Payments Header and Payments Detail tables since fields from both tables are required for reports about supplier payments.
Data catalog entries are shipped, but system administrators can edit or create them. Group and Sub-Groups can also be extended and customized.
Each data catalog entry consists of a single table, as well as the specified Group, and Sub-Group.
To create new entries, you must:
- Determine your table—You can select an existing table, or use a view or join table to refine, or combine, your data sources. Learn more in View tables.
- Determine your Group and Sub-Group categories—You can use an existing Group and Sub-Group, or add new entries into the
DataCatalogGroupandDataCatalogSubGrouplist lookups.
Report Quick Start
The Report Quick Start form action enables you to create an interactive report out of an application's table data, visualizations, filters, and sorts. The form action is available in the list form of all application types. Once selected, the Interactive Report Builder opens with the data and configuration options from the table you are viewing already imported. You can then edit and add any additional report options you would like. Learn more in Report Quick Start.
Tables
Building an interactive report over a table requires you to understand, and know, how to access the internal name of the required table. Every fields from the table selected becomes available for report creation.
Data Catalog application
System administrators use the Data Catalog application to define data sources which business users can select from when building an Interactive Report.
Each data catalog entry consists of a single table. If your report requires multiple sources, or a more refined source, you may need to build a new view or join table.
Entries are sorted into Groups, and Sub-Groups, which helps users select the correct data source at the time of report creation. For example, there are existing data catalog Groups for Distribution and Financials. In the Distribution group, there are Sub-Groups for Inventory and Procurement. In the Financials group, there are Sub-Groups for General Accounting, Payables, and Receivables. When a user expands the different Sub-Groups, they can view available data catalog entries, and select the source they need for their report.
In the Distribution Group, Inventory Sub-Group, users can select data sources for business uses like Item Ledger Transactions (All item ledger transactions), or in the Financials Group, Payables Sub-Group, a data source for business uses like AP Payments (Supplier Payments). The Item Ledger Transactions data catalog entry is built over a view table which refines the available fields to only those that are useful for interactive reports. The AP Payment data catalog entry is built over a join table which combines the Payments Header and Payments Detail tables.
Once a data catalog entry exists, it can be selected in the Interactive Report Builder with the Select a Data Source button.
Report Quick Start
The Report Quick Start form action enables users to create an interactive report out of an application's table data, visualizations, filters, and sorts.
The form action is available in the list form of all application types. Once selected, the Interactive Report Builder opens with the data and configuration options from the table you are viewing already imported. You can then edit and add any additional report options you would like.
For example, if you need to view a report of payments made in a certain month to a specific vendor, you can create filters for the month and vendor in the Payments application, then select the Report Quick Start form action. If you need to make calculations on those payments, you can add aggregate values or calculated columns in the report.
Learn more about interactive report configuration options in Interactive Report Builder.
Report versions in interactive reports
Report versions enable you to select different combinations of table layouts, filters, sorts, and visualizations to create multiple reports over the same data source. You can only view the different components in the interactive report if they have been added to a report version.
Interactive reports can have many different report versions available. This allows you to view and manipulate your business data in different ways. For example, an interactive report built over the ReceivablesJoin table could have a report version that shows data for all of the invoices for a company, and a different report version that shows all of the credits for a company. Each report version would have different summary tables, filters, sorts, and visualizations.
To view the report versions, select the View Report form action. Learn more in Interactive Report Viewer.
Create a report version
Select the Create button in the Report Versions section to build a new report.
Raw Mode
Select the Raw Mode checkbox to show raw data in the interactive report table, rather than the default user interface. For example, an address in the table with Raw Mode selected could look like the following:
{ "namenameinverted": 'Address', "Format2": "state, address" } |
Interactive Report Viewer
Use the Interactive Report Viewer to view the different versions of the report which have been created. Report versions consist of the layouts, field selections, filters and sorts, calculated columns, visualizations, links, and common context created over your data table in the Interactive Report Builder.
The diagram below illustrates the different components of the Interactive Report Viewer.
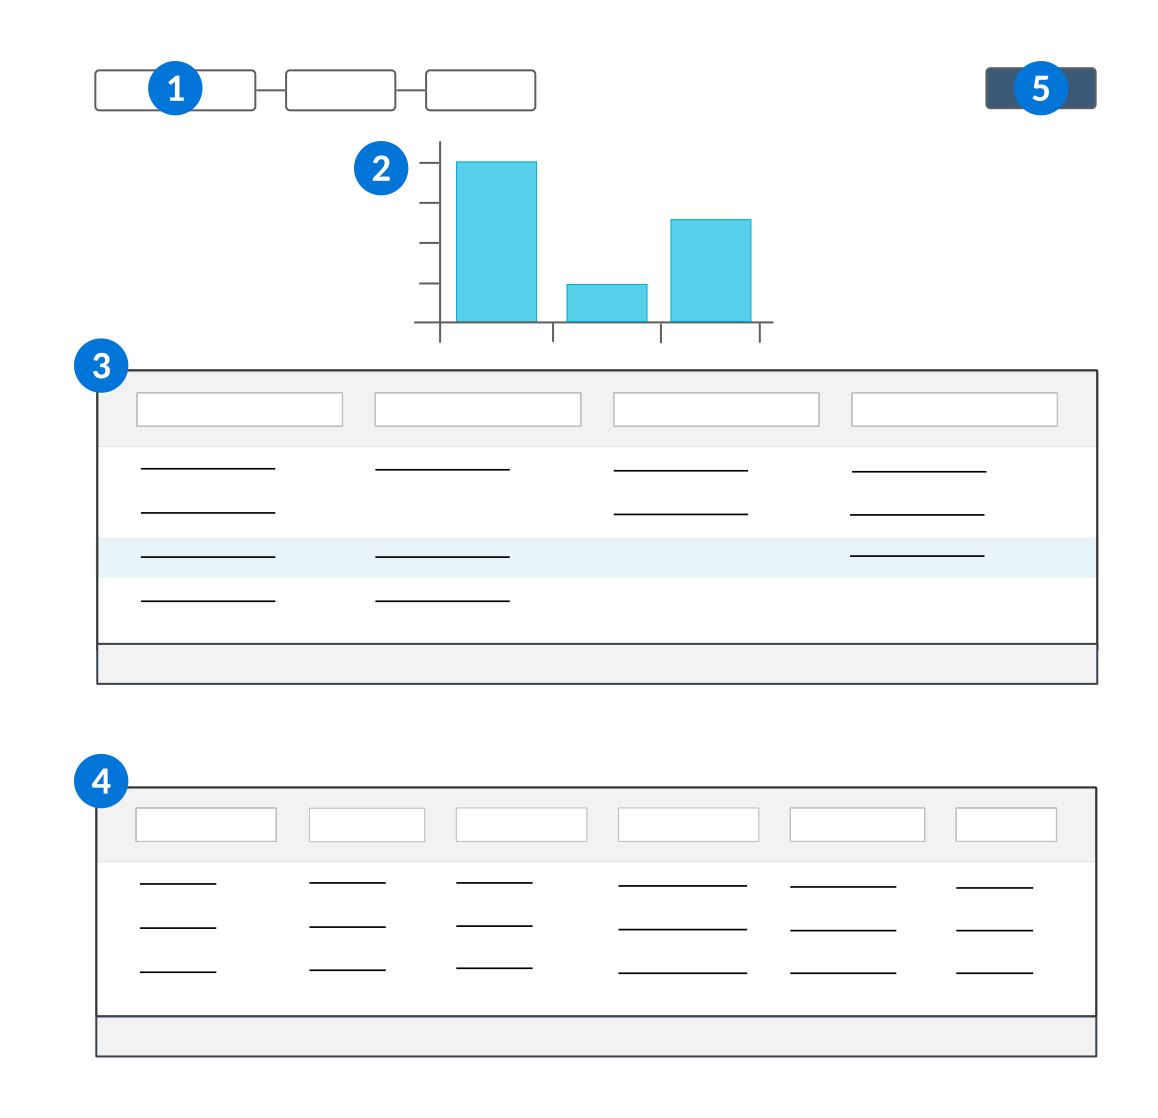
| Report Version menu—Select which report version you want seen in the viewer. |
|---|---|
| Visualization—The visual representation of your data which was selected in the report version. |
| Report Data table—Shows the table layout configured for the selected report version. Double select a row from the table to see additional details of the value in the Row Details table. |
| Row Details table—Shows you the details of the row selected in the Report Data table. |
| Actions Menu—Open to access the Export to CSV and Export to PDF features that enables you to export the Report Data and Row Details tables. Select one of the buttons to open the Export Options window. Enter a name for your file then select the Export button. You'll receive a message in the Notifications menu once the export has completed. Select the Download button on the notification to download your file. |
Table layouts in interactive reports
Table layouts enable you to create Report Data and Row Details tables with the specific columns, groups, pivots, and aggregates that you want to organize your business data.
The diagram below illustrates the different configuration options for your table layout:
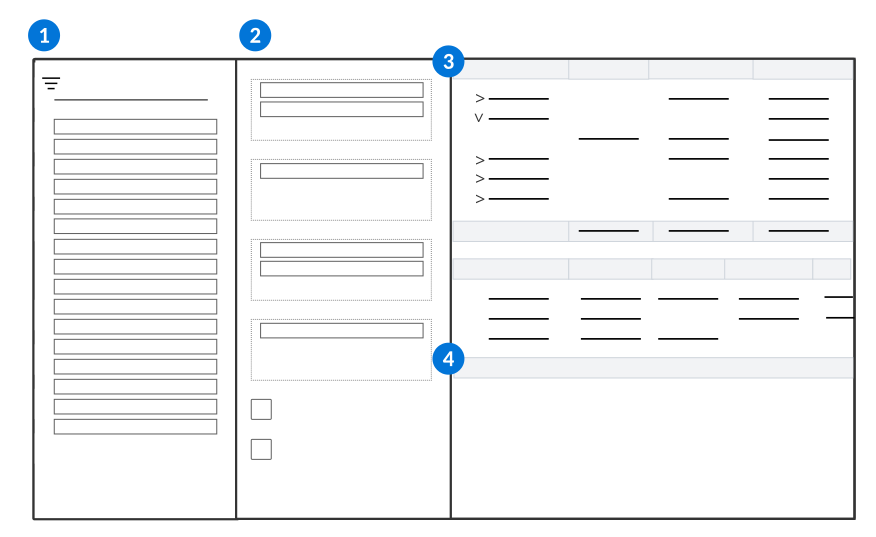
| Fields—Select fields from your data source to use in your Report Data and Row Detail tables. You can drag and drop fields into the table configuration options, or select the Add Field button in the field's box to open a dropdown menu of options, such as Add as Row Group. The Search  icon indicates the field is a lookup on another application's data. You can select multiple fields from that application, or use the dropdown arrow to view additional related fields which may be available for your report. For example, a Company lookup field that points to the Directory application provides fields like Company and Org Unit Number to use in your report. icon indicates the field is a lookup on another application's data. You can select multiple fields from that application, or use the dropdown arrow to view additional related fields which may be available for your report. For example, a Company lookup field that points to the Directory application provides fields like Company and Org Unit Number to use in your report. Expand Date and Date Time fields to add more granular components of the stored Date values to your report. For example, you could show just the Month or Year from the stored Date value, rather than the entire date. |
|---|---|
| Table configuration options:
Optionally, select the Format Configuration button to apply a style definition to field in your table layout. By default, interactive reports use a single currency code designated in the Table Layouts section. You can optionally configure Associated Currency to enable use of multiple currency codes. Learn more in Enable multi-currency in interactive reports. |
| Report Data table—The visual representation of your business data which is organized based on your configuration selections. |
| Detail Table—Select values inside the data table to see the related values specified by the Display Column fields. |
Example
You could create a table layout with the following values:
- Columns: Org Unit, Customer, Transaction
- Group Rows: Company
- Pivot: Status
- Aggregated Values: Transaction
- Include Row Aggregations: Selected
- Include Column Aggregations: Selected
With these layout selections, the Report Data table would show:
| Company | Status 1 | Status 2 | Status 3 | Transaction (Aggregate) |
|---|---|---|---|---|
| Company 1 | Number of transactions for Company 1 that are in Status 1 | Number of transactions for Company 1 that are in Status 2 | Number of transactions for Company 1 that are in Status 3 | Total number of transactions for Company 1 |
| Company 2 | Number of transactions for Company 2 that are in Status 1 | Number of transactions for Company 2 that are in Status 2 | Number of transactions for Company 2 that are in Status 3 | Total number of transactions for Company 2 |
| Company 3 | Number of transactions for Company 3 that are in Status 1 | Number of transactions for Company 3 that are in Status 2 | Number of transactions for Company 3 that are in Status 3 | Total number of transactions for Company 3 |
| Total number of transactions in Status 1 | Total number of transactions in Status 2 | Total number of transactions in Status 3 | Total number of transactions |
If you selected the row for Company 2 in the Report Data table, the Row Detail table would show:
| Company | Org Unit | Customer | Transaction |
|---|---|---|---|
| Company 2 | Org Unit 1 in Company 2 | Customer 1 of Org Unit 1 | Number of transactions for Customer 1 of Org Unit 1 |
| Company 2 | Org Unit 1 in Company 2 | Customer 2 of Org Unit 1 | Number of transactions for Customer 2 of Org Unit 1 |
| Company 2 | Org Unit 2 in Company 2 | Customer 1 of Org Unit 2 | Number of transactions for Customer 1 of Org Unit 2 |
Enable multi-currency in interactive reports
Configure Associated Currency in interactive reports to enable use of multiple currency codes in report layouts.
By default, interactive reports use a single currency code designated in the Table Layouts section. This limits the data which can be shown in a single report layout.
Associated Currency enables you to see currency fields with different currency codes in the same report, and to create report layouts with distinct groupings for different currency fields. This allows you to report over multiple currency types in a single report layout.
Configure
In the Table Layouts section of your report, add the Currency fields you want into your report layout. Select the Associated Currency  icon on each Currency field and select the field that defines the currency code.
The system automatically introduces a new row grouping for currency fields identified with the same associated currency code together in your report layout.
How to use hierarchies in interactive reports
Use hierarchies to display interactive report data in a hierarchal format within a single column of your report. This helps you track how business data, such as financial information, exists in a hierarchal structure.
Hierarchies are dictated by existing relationships between records and are only available for certain fields. Access available hierarchies in your interactive report by dragging a search field, also known as a table lookup field, into the Group Rows section of table layouts. Select the Apply a hierarchy definition button on the field to view the available hierarchies.
For example, a company structure table could store hierarchal relationships between companies and different types of org units, such as:
- Company: Holds aggregate business data about all of the warehouses within each company.
- Region (type of Org Unit): Used to categorize warehouses, but does not hold any business data.
- Warehouse (type of Org Unit): Holds business data about this specific warehouse.
- Region (type of Org Unit): Used to categorize warehouses, but does not hold any business data.
An interactive report without a hierarchy selected could have a Group Rows for Company, and one for Org Unit, but would only show rows for Warehouses in the Org Unit column since Regions don't hold any business data.
The table below shows a summary table in an interactive report with the following field selections:
- Group Rows: Company, Org Unit
- Pivot: TransactionType
| Company | Org Unit | Customer Invoice |
|---|---|---|
| > Company A | 9999 USD | |
| v Company B | 800 USD | |
| Warehouse A | 200 USD | |
| Warehouse B | 300 USD | |
| Warehouse C | 300 USD |
If there is a hierarchy configured on the Company field, you can select it in order to use the hierarchal structure that exists on the company structure table in your report. Once selected, the parent relationship defined in the hierarchy, in this case Company, is shown in an expandable tree structure within one column. Each company record can then be expanded to show the regions that exist underneath them, and each region can be expanded to show the existing warehouses. This would enable you to see aggregated business data for the warehouses within each region.
The table below shows a summary table in an interactive report with the following field selections:
- Group Rows: Company (Hierarchy definition selected)
- Pivot: TransactionType
| Company | Customer Invoice |
|---|---|
| > Company A | 9999 USD |
| v Company B v Region 1 > Warehouse A v Region 2 > Warehouse B > Warehouse C | 800 USD 200 USD 200 USD 600 USD 300 USD 300 USD |
Filter and sorts in interactive reports
Filters and sorts enable you to refine the data shown in your interactive reports, and organize it by ascending or descending values. Interactive reports can have default filters and sorts applied to different report versions.
Pinned Filters
Use pinned filters to enable users to quickly filter report data based on a given field. For example, you could configure a pinned filter for the Account Number field. In the Report Viewer, users could enter different account numbers to filter the report data based on the account selected.
Optionally, you can configure a default value in the pinned filter that applies when the report is launched. Users can clear or apply a different value. You can also make your pinned filter required in the Filter Options menu during configuration.
Pinned filters are configured during the interactive report design, and display every time the interactive report is launched.
Advanced Filters and Sorts
Use advanced filters to refine and sort the report data with expressions which consist of fields, operators, and values, defined in the filter.
For example, you could configure an expression to display records with a balance equal to $100, a condition type of and, then a second expression to filter for Today. When the Report Viewer is opened, only records that have both a balance of $100 and the current data would display. If your condition type is or, records that have either a balance of $100 or the data of Today would display. Learn more in Advanced Filter.
Advanced filters require a value to be populated during the interactive report design. Users can change or clear the advanced filters while in the Report Viewer, but changes do not persist.
Calculated columns in interactive reports
Calculated columns display results of a calculation defined between two or more columns, or two or more values within the same column, in an interactive report.
Calculations can be between any Currency or Number fields available in the data source, even if they are not displayed. Once a calculated column is configured, it can be used in the calculations for other columns, or in visualizations.
For example, an interactive report built over the GLPeriodBalances table has currency fields for Credit and Debit. If you wanted a column that shows the Net Amount, you could create a calculated column which subtracts the Debit field from the Credit field. With these configurations, you could have a report data table which shows the following columns:
| Company (field on GLPeriodBalance table) | Credit (field on GLPeriodBalance table) | Debit (field on GLPeriodBalance table) | Net Amount (calculated column of Credit - Debit) |
|---|
Or, you could configure a calculated column which divides Net Amount by the aggregated sum of the Net Amount column. With these configurations, you could have a report data table which shows the following columns:
| Company (field on GLPeriodBalance table) | Net Amount (field on GLPeriodBalance table) | Percent of total Net Amount (calculated column of Net Amount Total / Net Amount Value for each row) |
|---|
Create a calculated column
To configure a calculated column, select the Create button in the Calculated Columns  section. Name your column, then drag fields, other calculated columns, and math operations into the expression.
Optionally, select a value in the Type field. If no value is selected, the system automatically selects the most appropriate format type for the column. Options include:
- Number—Formats the column to display as a number. This allows you to select the number of decimals you want displayed for the value, or to format the column values as percentages.
- Currency—Formats the column to display with whatever currency value is associated with the data item.
Once the calculated column is created, you can select it like any other field when you build your summary table in the Table Layouts section.
Report buckets in interactive reports
Report bucket definitions enable you to dynamically categorize records in interactive reports based on specified date ranges.
Bucket definitions are configured in the Report Bucket Definitions application. You can use a previously created definitions in your interactive reports, or create your own. The same definition can be reused in multiple reports since it defines the criteria for how the data should be organized, but is not built over a specific application table.
Bucket definitions create columns with specified date ranges. Records are then sorted into those columns based on the type of bucket configured. A bucket definition sorts records in one of the following ways:
Relative Date—The records in the report are organized based on date ranges which are relative to a specific date.Relative Period—The records in the report are organized based on date ranges which are relative to a specific period within a fiscal year.
To view examples of how bucket definitions group the data, see Report bucket example.
Add a bucket definition to your report
In the Bucket Definition section of your interactive report, you must:
- Select the type of bucket definition you want in your report. You can choose either
Relative DateorRelative Period. - Select the field which holds the date value that determines whether a record fits into a bucket column.
- Optionally, use the asterisk * key to review available bucket definitions. If no definition is selected, users can choose which one to use at runtime.
- Enter any default inputs you want for the definition.
Once you have added a bucket definition to your interactive report, you can add it to different table layouts and report versions. Bucket definitions can only be added as pivot fields.
When you open the Report Viewer, you can select any bucket definition which you have added to your report, or change the default inputs.
Visualizations in interactive reports
Use visualizations to display data in a visual format, such as a graph or pie chart. Build visualizations in the Visualization Builder accessible from the Application Builder and Interactive Report Builder.
A visualization is built from records in a table. Filters applied to the data table also apply to the visualization. There are multiple places to use visualizations, such as:
- Applications—The visualization appears above the data table on the list form of the application. When there are multiple visualizations configured, a dropdown menu allows users to select which is visible. Configure application visualizations in the Visualizations section of the Configuration panel.
- Dashboards—The visualization appears as a read-only display of the data in a dashboard card. Configure dashboard visualizations in the application, then reference the application in a dashboard card.
- Interactive Reports—The visualization appears in reports. Configure report visualizations in the Visualizations tab of the Interactive Report Builder.
There are three panels used for configuration in the Visualization Builder. Each panel serves a different purpose in configuration, as seen in the diagram below.
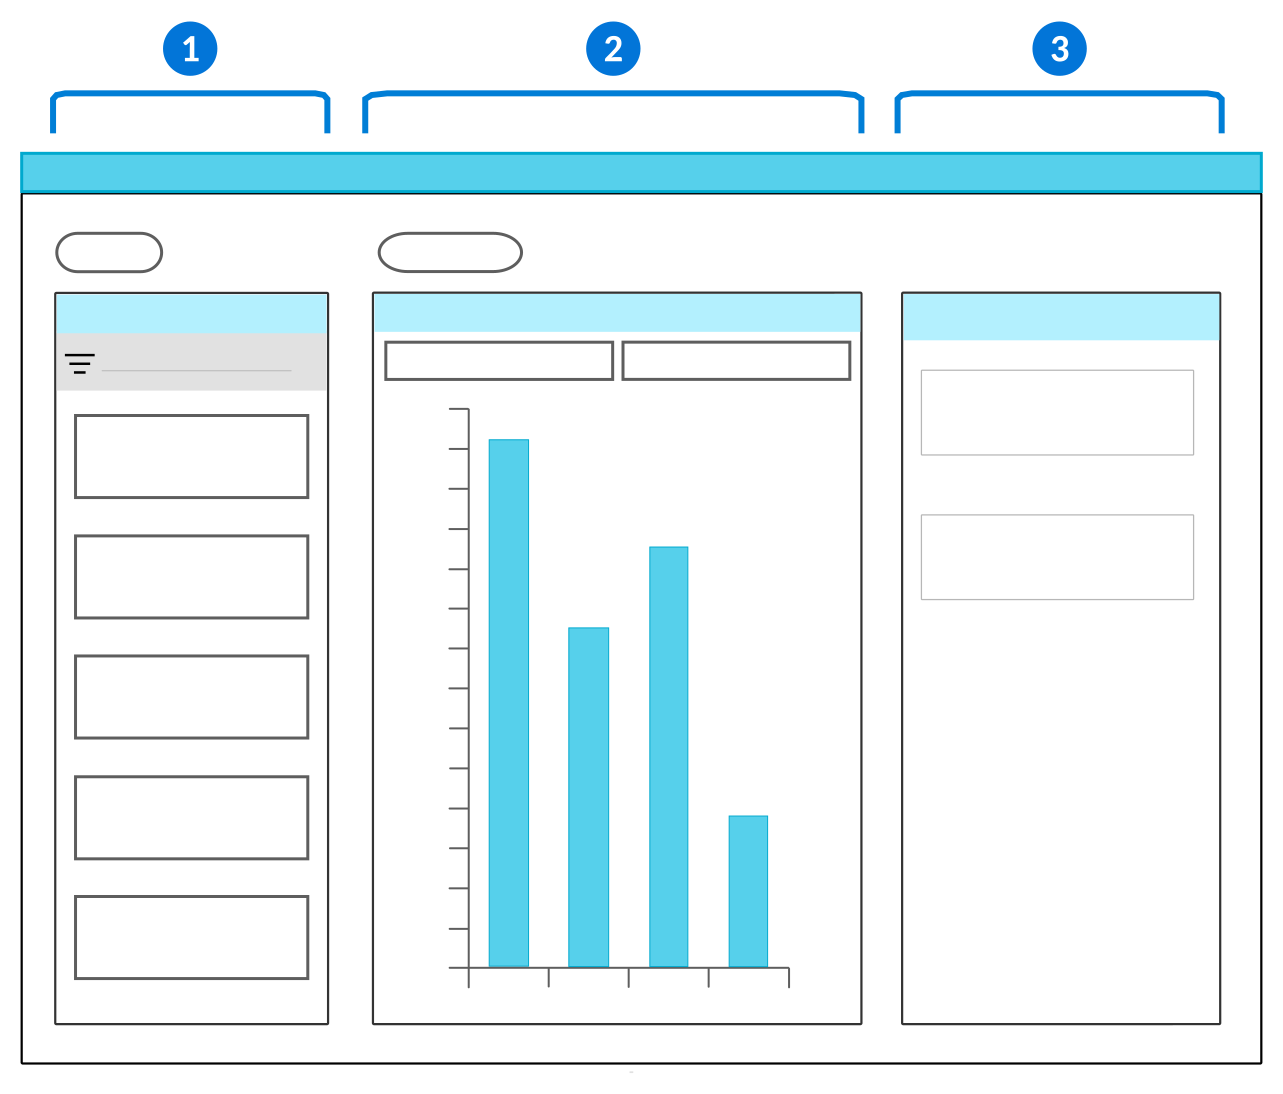
| Fields panel—Containsthe fields you can use to build your visualization. Use the drag and drop function to move the fields from the Fields panel into the Viewer panel. |
| Viewer panel—Contains the x-axis and y-axis fields where you can drop the fields you selected from the Fields panel. You can only have one field in the x-axis field, but there is no limit on how many fields can be placed in the y-axis field. Select the visualization Type to determine how the data is shown. See the Visualization types topic for more information. |
| Details panel—Contains the characteristics and attributes of the fields you select. Additionally, enables you to group the data or select different color formats. Color formatting allows you to define conditions and colors for different stylizations of the visual data. For example, you can:
|
Certain visualization Type also must be configured with a Data Shape to further define how the data is shown. There are multiple data shapes to choose from, such as:
Row Based—Values of each y-axis field are plotted on the visualization as separate series on the visualization. Values of the x-axis field create the categories on the x-axis.Aggregation Based—Values of the y-axis provide aggregations of all the application records instead of displaying specific values. Values of the x-axis field group the aggregated values from the y-axis. For example, a count of unpaid invoices is your y-axis, grouped by each month in the year as your x-axis.Column Based—Values for the x-axis and y-axis come from the same data item. The value of the record is used for the y-axis. The label of the data item found on the Synonyms page is used for the x-axis. Select as many data items as you want to appear on the visualization.
Visualization types
Determine which type of visualization to use based on what information you want to display, or how you want to display it.
For example, you could use an information box visualization to show a count of open invoices, and a line graph to show the amount of each open invoice. There are several different types of visualizations, as seen in the table below.
| Type | Example | Description |
|---|---|---|
 | Use x-axis and y-axis quantitative values to display a line chart with a colored area between line and axis. The points on the line are connected with a straight line that forms a slope. | |
 | Use x-axis and y-axis quantitative values to display a line chart with a colored area between line and axis. The points are connected with a curved line that form a slope. | |
 | Use x-axis and y-axis quantitative values to display a line chart with a colored area between line and axis. The points are connected with line segments that form steps. | |
 | Use x-axis and y-axis values to display categorical data represented by vertical bars. | |
 | Use x-axis values to display aggregated data in a circular graph divided into sections with a blank center. Each section represents a portion of the sum of all of the data. | |
 | Use x-axis values to display aggregated data in individual gauges. The colored part of the gauge represents the quantity compared to the defined maximum, counting up from zero. | |
 | Use x-axis values to display aggregated data in a unified gauge. Each ring of the gauge represents a different aggregation. The colored part of the gauge represents the quantity compared to the defined maximum, counting up from zero. | |
 | Shows specific locations defined in records on a map. Learn more in Geo map visualization configuration. | |
 | Use x-axis values to display aggregated numbers on colored boxes. Each box represents a different aggregation. | |
 | Use x-axis and y-axis quantitative values to display data points connected by straight lines. | |
 | Use x-axis and y-axis quantitative values to display data points connected by curved lines. | |
 | Use x-axis and y-axis quantitative values to display data points connected by straight lines that form steps. | |
 | Adds labels to named locations of a picture. Example use cases are people on a seating chart, assigned parking spaces, tenants on a building floor plan, or components on a product diagram. The visualization background and named locations are defined in the Picture Map Definitions application. | |
 | Use x-axis values to display aggregated data in a circular graph divided into sections. Each section represents a portion of the sum of all of the data. | |
 | Use x-axis values to display aggregated numbers with a row of circles. Each circle represents a different aggregation and has a percentage value in the middle of the circle. The outer ring of the circle represents the percentage. | |
 | Use x-axis and y-axis quantitative values to display data points in the plot area. | |
 | Displays building information arranged into stacked floors. Each floor is divided among units and aggregations display on the side of each floor. |
Determine the type of visualization you want to use, based on what kind of information you want to display. The table below shows how the different visualization types will display your information:
| If you want to... | Visualization Type |
|---|---|
| Compare information | |
| Show relationships | |
| Show parts of a whole |
Links in interactive reports
Links enable you to navigate to related applications, dashboards, or other interactive reports from the Report Viewer.
You can access links from either a field or row action menu in the Report Data or Row Detail table. Open the Action  menu to see which Links
  are available. If no links are configured, no action menu is visible.
Some links default values from the report into the destination's fields or filter fields. This helps refine the visible business data in the destination.
For example, an application link may create filters that shows you records in the destination which have revenue less than the average revenue summarized in your report.
Or, a link may navigate you to the detail form of an application where values from your report are already filled into selected fields. This would enable you to create or compare detail lines that impact your report data.
Configuring links requires moderate application development knowledge. Learn more in Configure links in interactive reports.
Common context in interactive reports
Use common context to populate fields or filters in one application or interactive report based on a value published in another application or report. Or, use common context to create or select a record in an application link based on a published value.
Common context has two components:
- Publishers—The field which dictates the values populated in the Subscribers. When a value is entered or published into a publishing field, it populates all the subscribing fields configured in the same scope.
- Subscribers—The field or application link which is populated by the publishing field value.
Example
Common context is often used to filter for records with related information amongst multiple applications or interactive reports. For example, on a dashboard page you could configure common context so that when a customer name is entered in an application field, other applications or reports populate the customer's transaction and contact information in their respective cards.
Similarly, in a composite application, you could configure common context so that when a customer name is entered in the first application step of the composite, the selected customer's information would be visible in subsequent application steps.
The diagram below shows a dashboard page with common context configured in three applications used as dashboard cards:
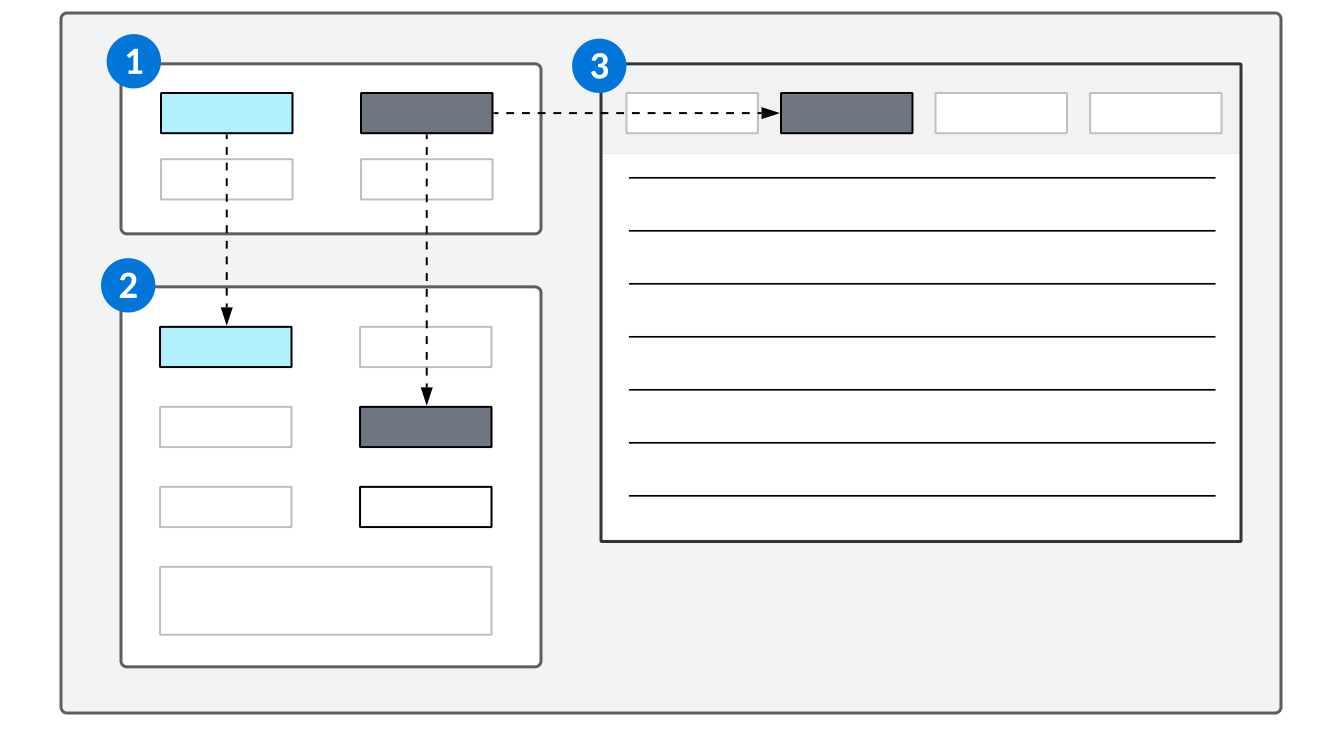
| The application is configured with two Publisher fields. |
|---|---|
| The application is configured with two Subscriber fields. The values in each Publisher field populate the Subscriber fields within the same scope. |
| The application is configured with one Subscriber field. The value in the Publisher field populates the Subscriber field within the same scope. |
View an example of a dashboard using common context in Example: common context on a dashboard.
Scope
Common context is configured within a scope. The scope defines in what context a Subscriber listens to a Publisher. This is necessary because Publishers and Subscribers can have one-to-many, many-to-one, and many-to-many relationships. The scope is defined using the data mapper tool when configuring the Publisher or Subscriber. You can also create a boundary for the common context scope in both a dashboard page, or a composite application configuration. This enables you to use the same application in multiple places without it being impacted by the common context tied to it elsewhere.
Learn more in Common Context configuration.
Common context can be used in place of, as well as in addition to, logic blocks and application settings to control field values.
Advanced configurations for interactive reports
There are optional advanced configurations which you can use in your interactive reports. These configurations require application development experience and security access.
The following topics review these configurations:
- Add interactive reports to the menu and dashboards
You can add interactive reports to dashboards using the Quick Create Dashboard Card row action. Application developers can also add interactive reports to dashboards and the Navigation Menu using the Application Setting Definitions, Menu Definitions , and Dashboard Card Builder applications.
- Configure hierarchies for interactive reports
Configure hierarchies for interactive reports in the Table Definitions and Hierarchy Definitions applications.
- Configure links in interactive reports
Configure links for interactive reports in the Links and Common Context sections of the Interactive Report Builder .
- Configure common context in interactive reports
Configure common context using the Application Builder or Interactive Report Builder to control values when viewing, filtering, and creating records on dashboard pages, applications, and interactive reports.
- Configure report bucket definitions
Application developers use the Report Bucket Definitions and Merge Text Template Setup applications to create bucket definitions. Bucket definitions allow users to dynamically categorize their records in interactive reports and report version applications.
- Summary tables
Summary tables take records from one or many transactional tables and then aggregate, manipulate, and summarize those records. This enables you to build interactive reports over the summary data where you can further refine, filter, and pivot.
Configure hierarchies for interactive reports
Configure hierarchies for interactive reports in the Table Definitions and Hierarchy Definitions applications.
Hierarchies require multiple configuration objects, including:
- Entity table—The table of type
Mainthat holds the values that you are trying to relate to each other, such as people, accounts, or items. - Relationship table—The table of type
Mainthat creates the connections between records that are stored in the entity table. - Hierarchy table—The table of type
Mainwhich has table lookup fields that point to the parent and child entity, as well as additional fields that you reference in the hierarchy definition. This table is referenced in a join table to link it to your interactive report. - Join table—The table of type
Jointhat connects the table the interactive report is built over with the hierarchy table you configure. - Hierarchy definition—The definition that links the relationship table, interactive report table, and hierarchy. This enables users to select the Apply a hierarchy definition button in an interactive report to display records in the hierarchy you configure.
Prerequisites
You must have a a relationship table built over the entity table which you want the hierarchy configured on. Learn more in Relationship application structure.
Table Definitions - Hierarchy
In the Table Definitions application, create your hierarchy table. You must:
- Build a table of type
Main. - Reference the same Child Field and Parent Field as the relationship table.
- Include the following data items:
ParentHierarchyDepthChildHierarchyDepthHasChildren- A table lookup data item which points to the parent entity.
- A table lookup data item which points to the child entity.
Table Definitions - Join
In the Table Definitions application, create your join table. You must:
- Build a table of type
Join. - In the Join Type field, select Left Outer Join.
- In the Join Type subtable, configure your join with the following fields:
- In the JoinFields.TableSchemaForJoins field, select the hierarchy table you configured.
- In the JoinFields.Table1Fields field, select the table lookup field from your hierarchy table which uniquely identifies the child records (nwId).
- In the JoinFields.TableSchemaForJoins2 field, select the table your interactive report is built over.
- In the JoinFields.Table2Fields field, select the table lookup field from your interactive report table which you are applying the hierarchy to.
Hierarchy Definitions
In the Hierarchy Definitions application, you must:
- Create a new record.
- On the General page, in the Relationship Table field, enter the name of your relationship table.
- In the Relationship Mappings subtable, map the table and fields from the parent and child records you want included in the hierarchy.
- On the Flat Table Configuration page, in the Hierarchy Table field, enter the name of your hierarchy table.
- Optionally, in the Entity Related Fields subtable, map related fields from the entity table to your hierarchy table. Entities in the hierarchy table are nwIds that point to the entity table. Related fields are other fields from the entity table that must also be included in the hierarchy table.
- On the Join Table Mappings page, in the Interactive Report Mappings subtable, enter the name of your interactive report data source and the name of the join table you created. For each table you want to apply this hierarchy definition to, you must include an entry in the subtable.
Hierarchy Definitions application
Use the Hierarchy Definitions application to define hierarchies that can be used in interactive reports. Hierarchies display records in a hierarchal format within a single column of the report based on existing relationships between records.
For example, you may want to include a hierarchy in your report to view aggregate data from different levels within a company structure. Learn more in How to use hierarchies in interactive reports.
Before you configure a hierarchy definition, you must configure a hierarchy table and join table. Learn more in Configure hierarchies for interactive reports.
General page
Select the relationship table which the hierarchy is built over, and map the parent and child relationships from the table.
Flat Table Configuration page
Select the hierarchy table which links the relationship table to this definition. Map the fields from the hierarchy table which identify the parent and child records, as well as any related fields from the interactive report table that you want included.
Join Table Mappings page
Select the interactive report tables which you want this hierarchy available in.
Configure links in interactive reports
Configure links for interactive reports in the Links and Common Context sections of the Interactive Report Builder.
To configure, navigate to the Links section and:
- Select your source region. This can either be the
Report Datatable or theRow Detailstable. - Enter the Source Field where you want to attach the links. If no field is entered, the link is attached as a row action by default.
- If you do select a field, enter a Source Field Aggregate.
- Select your Destination Type. This can be another interactive report, an application, or a dashboard.
- Enter the Destination Name. This is the internal name of the report, application, or dashboard where you want the link to navigate to.
- For destinations of type
Application, enter the default form which you want the application to open in.
- For destinations of type
- If the destination is a report or application and has an application setting, enter it in the Destination Setting field.
Mappings
You can optionally create mappings which pull values from the selected report into the destination.
For links of destination type Application, you can create mappings in the Link section. Then, navigate to the appropriate Report Version and select the name of your link in the Link field.
For example, you may have an interactive report which pivots and summarizes transactional data from a financial application. If you wanted to filter the destination application for records which have revenue less than the summarized revenue value from your report, you would configure mappings with the following values:
| From | To |
|---|---|
| Field | Filter Field |
| Revenue | Revenue |
| Sum | Less than or equal to (<=) |
When someone selects the application link, it would navigate them to the application and only show them the records which have a Revenue less than or equal to the Sum of the Revenue from the field or row in the report where you selected the link.
For links of destination type Interactive Report, data mappings need to be created in the Common Context section. Any mappings created in the Link section are not applied. To configure, you must:
- Navigate to the Common Context section of your report and configure your Publisher mappings. Then, navigate to the interactive report record which is the destination to configure the Subscriber mappings. Learn more in Configure common context in interactive reports.
- Navigate to the appropriate Report Version in both your Publisher and Subscriber reports and select the name of your common context configuration in the Common Context field.
Configure common context in interactive reports
Configure common context using the Application Builder or Interactive Report Builder to control values when viewing, filtering, and creating records on dashboard pages, applications, and interactive reports.
Common context Subscribers and Publishers are configured in the Configuration panel, in the Field Dependencies section in the Application Builder, or in the Common Context section of the Interactive Report Builder. Publishers are the source from which Subscribers receive data and are usually configured within separate applications or reports.
Scope
Publishers and Subscribers are grouped using a scope. The scope defines in what context a Subscriber listens to a Publisher. This is necessary because Publishers and Subscribers can have one-to-many, many-to-one, and many-to-many relationships. The scope is defined using the data mapper tool when configuring the Publisher or Subscriber. Common context can be used in place of, as well as in addition to, logic blocks and application settings to control field values.
Scope boundary
You can create a boundary for your common context scope so that if the application or interactive report is reused elsewhere, it is not impacted by common context tied to the dashboard or composite application you configure.
On a dashboard page record, select the Common Context Scope Boundary checkbox.
In a composite application record, navigate to the Composite Configuration page and select the Common Context Scope Boundary checkbox.
Publishers
The table below describes the Publisher options available for common context as well as any specific configuration requirements:
| From (source) | To (destination) | ||
|---|---|---|---|
| Field | Description | Field | Description |
| Select table (Source) | Select the location from which you want to map the value. If no source is selected from an application publisher, values will be published from both the list and detail regions of the form. | Define a scope | Enter the name of the scope this publisher is part of. This can be the same scope as other publishers, or it can be a newly created scope you're defining. |
| Field (Source) | Select the field or subtable field in the application or report to use as a publisher. The value in this field is used to populate subscriber fields. | Destination Field | This field populates automatically, based on the Source Field. If the Source Field is a table lookup field, this field populates with the source field and the related field. |
| Source Related Field | If the Source Field is a table lookup field, use this field to select the related field. |
For example, the ReceivablesCommonContext application uses the Contact field as a publisher to other cards on the Receivables Dashboard page, and uses the following configuration:
| From (source) | To (destination) | ||
|---|---|---|---|
| Source Form | Detail | Scope | ReceivablesScope |
| Source Field | Contact | Destination Field | Contact_Name |
| Related Source Field | Name |
Subscribers
The table below describes the Subscriber options available for common context as well as any specific configuration requirements:
| From (source) | To (destination) | ||
|---|---|---|---|
| Field | Description | Field | Description |
| Common Context Method (only in Application Builder) | Select Subscribe to Common Context. | Destination Type (only in Application Builder) | Select one of the following destination types to which your data will be mapped:
|
| Scope | Enter the name of the scope associated with the publisher you want to subscribe to. | Destination Region | Depending on what Destination Type you chose, select a form or region to which your data will be mapped. |
| Field (Source) | Enter the name of the field associated with the publisher to which you want to subscribe. | Destination Field | Select the field in the application or report which you want to populate. The value of this field populates when any value that is published. |
| Filter Prefix | Select from the following values for filtering (optional):
| Destination Related Field | If the Destination Field is a table lookup, select the related field. |
For example, the ContactNotesMini application uses the Contact field as a subscriber to the Contact field on the Dashboard Filter dashboard card, and uses the following configuration:
| From (source) | To (destination) | ||
|---|---|---|---|
| Common Context Method | Subscribe to a Common Context | Destination Type | Filter Field |
| Scope | ReceivablesScope | Destination Region | List |
| Source Field | Contact_Name | Destination Field | Contact |
| Filter Prefix | = Exact Match | Destination Related Field | Name |
View an example of a common context dashboard configuration in Example: common context on a dashboard.
Common Context Monitor
You can use the Common Context monitor to show which publishers and subscribers are recognized and whether they are populated. If a publisher or subscriber doesn't appear, it is not configured correctly. If it appears but is not populated, you may have selected the wrong publisher field or typed the subscriber incorrectly.
Access the Common Context Monitor by opening the Sidebar Menu, expanding the Monitors section, and toggling on Common Context.
Summary tables
Summary tables take records from one or many transactional tables and then aggregate, manipulate, and summarize those records. This enables you to build interactive reports over the summary data where you can further refine, filter, and pivot.
Interactive reports can be built directly over a transactional table, but can have slow performance with large datasets. Summary tables filter the transactional tables for the required data, perform logic block calculations over that data, then categorize and summarize it in meaningful ways. Interactive reports built over the summary table have much better performance since the underlying table has already done most of the data manipulation. For example, an interactive report built over an AccountReceivable table would potentially have to load 100,000 records each time the report was opened. Users would then have to use the interactive report features to filter and refine the data into meaningful patterns. Instead, a summary table built over the same tables would have up-to-date summarized information from that table already ready for the interactive report to query.
Additionally, summary tables can perform complex calculations that interactive reports are unable to do since they can use logic blocks during processing.
Records from transaction tables are tracked in real-time, then categorized in the summary tables with a dimensional modeling approach. Dimensional modeling uses metrics, dimensions, and display fields to sort records into related groupings. Each unique dimension set has a single record within the summary table that is continuously updated by records from the transaction tables that have the same dimension values.
The table below reviews important terminology for dimensional modeling and summary tables, and provides examples of how each aspect would be configured for a Receivables summary table:
| Term | Definition | Example for a Receivables summary table |
|---|---|---|
| Data Sources | The transactional tables that feed into the summary table. | ReceivablesHeader, CashReceiptsHeader, AppliedCashReceiptsDetail, ReceivableAdjustments tablesThis would feed receivable records from multiple application tables into the summary table. |
| Dimensions | The data which provides contextual information about your metrics. This is generally not transactional information like credits or debits, but values like company name or dates that help sort the transactional data into meaningful categories. Unique combinations of dimension values create the categories which the transaction records are sorted into. Unique indexes are automatically created from the dimension fields specified. | EffectiveStartDate and OrganizationalUnitThis would create a summary table record for each org unit and transaction date combination. Then, transactional records from all of the data source tables would be sorted into the summary table record that matches their effective start date and org unit. |
| Indexes | Summary table indexes are automatically created based on the dimensions you specify. They help maintain data integrity, and improve performance. Learn more in Indexes. | Having dimensions for EffectiveStartDate and OrganizationalUnit creates indexes that filter the data first by the start date, then by the org unit. This helps the system quickly narrow down and identify records based on the unique value combinations of those fields, and improves performance when the summary table is queried. |
| Metrics | The data, most often numerical, which measures aspects of your business. This is generally transactional values, such as credits, debits, or voids. Once the transactional records are sorted into their dimension set, their metric values are aggregated and summarized in the summary table record. | AppliedAmount, UnappliedAmount, AdjustmentAmount, VoidAmount, and GrandTotalThis would aggregate the applied amount, unapplied amount, adjustment amount, void amount, and grand total values from every transactional record that is within the dimension set. The summary table record shows a single, aggregated value that represents the cumulative values of all of the records that match the dimensions. |
| Display Fields | Optional fields which contain non-categorical values related to your dimensions. Display fields should provide context to your summary table data. | TransactionCurrency This would ensure that the currency code for the transactional records is visible in your summary table. Currency code is not a useful way to categorize the data, or a value that needs to be aggregated, but it is useful information to have present in the record. |
Summary values for metrics are continuously updated by new transactions, so when records are entered into the transaction tables, the system reviews the EffectiveStartDate and OrganizationalUnit values then updates the appropriate summary table record with those values.
Summary table types
There are several types of summary tables which provide different functionality, such as:
Cube—The most basic summary table type. Use cube summary tables when you want logic block calculations applied to records as they are processed. Results of these calculations can then be used by business users in interactive reports. Learn more in Cube Summary Table Definitions application and Cube summary table configuration.Periodic—Has all of the functionality of a Cube summary table but also allows you to summarize business data based on fiscal year and periods. Periodic tables allow complex logic to be configured when values are rolled forward from one period to the next, so accurate cumulative balances, such as year-to-date, values can be summarized, and previous year data can be omitted from roll forward behavior if desired. Learn more in Periodic Summary Table Definitions application and Periodic summary table configuration.As Of—Has all of the functionality of a Cube summary table but also allows you to summarize business data based on an As Of date or date range. As Of tables allow logic block calculations to be applied to historical values balances from a certain point in time. For example, you may want to view the open balance for a customer on January 1, 2023, and compare it to their open balance at the end of the month.
Activations
Once you've built your summary table, you must activate it with the Activate form action in the summary table definition. Activated summary tables have a record in the Summary Table Activations application. Summary tables only begin receiving data from transactional tables once they have been activated. Activated tables cannot be changed. If you do need to make changes to the underlying summary table definition, you would need to activate the table again once you have completed your changes. The updated table would then have its own record in the Summary Table Activations application.
You can have multiple activated summary tables from the same definition, but only one of those activations can be queried by the system. Mark an activation as the Primary activation in the summary table activation record to make it available for use in interactive reports.
Table lookups in summary tables
If you want a table lookup's related fields analyzed in reports built over the summary table, there are several configuration options outlined in the table below:
| If the value of the related fields at the time of record creation... | Add the... | Considerations |
|---|---|---|
| Does not need to persist if the related field subsequently changes... | Table lookup field as a dimension or display field. | If a related field changes after the primary record has been written, the original value of the related field is lost. |
| Must persist if the related field subsequently changes, even if a summary table rebuild occurs... | Table lookup's related field to the transactional table as a new field, then use that field to populate a dimension or display field on the summary table. | If a related field changes after the primary record has been written, the related field value persists with the transaction. |
| Should persist if the related field subsequently changes, but can change if a summary table rebuild occurs.. | Table lookup's related field as a dimension or display field. | If a related field changes after the primary record has been written, the related field value remains the same unless a summary table rebuild occurs. In those instances, the current value of the related field during the rebuild is applied when the primary table reprocesses the records. This method is not recommended for related table lookup dimensions which may change. If a dimension for a transaction record no longer matches its prior dimension, the system treats that summary table record as a new record. |
Cube Summary Table Definitions application
Use the Cube Summary Table Definitions application to define the components for cube summary tables, and to activate and manage current versions of those tables.
Learn more in the Cube summary table configuration topic.
General page
After filling out the fields on the General page, save the definition. Saving the definition creates the Data Table and associates it with the summary table. The Data Table is the table you’ll query in a logic block when fetching data from the cube summary table.
Optionally, select the Enable Record Log checkbox to track the summary table records' processing status. When selected, the Record Log Table which stores the record log data is automatically created at the time of save. Learn more in Track processed summary table records.
Data page
Select your data sources for the cube summary table, and create unique names for different types of events, such as a transaction for posting an invoice and a transaction for voiding an invoice. This allows you to apply different metrics, dimensions, and logic blocks to different types of transactions.
Optionally, create filters to limit the records which are tracked by the summary table. Records that match the filter criteria initiate the event. If a record matches multiple filters, it runs both events. If a record matched filter criteria, but then changes to not match the filter, it is removed from the summary table.
Dimensions page
Define the dimensions which form the summary table. Dimensions are used to categorize how records are summarized. Every record tracked by this summary table will be converted into a dimension set, and applied to the summary record matching all of its dimension values.
All dimensions added on this page must also have data mappings assigned from one of the data sources specified.
Metrics and Display Fields page
Select the metrics you want included in the summary table. Metrics are numeric summaries of dimension values, and are continuously updated by new transactions that impact the summary table.
Optionally, use the Display Fields subtable to configure display fields you want included on the summary table. Display fields are non-categorical values that are attached to summary table records that don’t fit into the dimension or metric categories. For example, Unit of Measure or Computation Method.
Transactional Event Logic Blocks page
Create the logic block you want used for any logic block calculated metrics, as well as any display fields.
Save the definition to create the Transactional Event Logic Block Table. Any changes saved to the definition are also reflected in the table. This means the transaction event table always contains the fields defined in the summary table.
You can also run a logic block each time a transaction is processed in the table. Select the name of the logic block in the Transactional Event Logic Blocks subtable.
Optionally, make fields from transaction data sources available to transactional event logic blocks in the Transactional Event Work Fields subtable.
Cube summary table configuration
Configure a cube summary table with the Cube Summary Table Definitions application and the Logic Block Builder.
Configure your cube summary table with the following applications:
- Cube Summary Table Definitions application—Build your summary table definition. Use application links and form actions to navigate to the Logic Block Builder and Summary Table Activations application as needed.
- Logic Block Builder—Configure a transactional event logic block which calculates and assigns logic block calculated metric and display fields.
- Summary Table Activations application—Activate your summary table so it starts to run and receive data. Mark as Primary when you want your summary table to begin being queried by the system.
Cube Summary Table Definitions
In the Periodic Summary Table Definitions application, you must:
- On the General page, optionally select the Enable Record Log checkbox to track the summary table records' processing status. When selected, the Record Log Table which stores the record log data is automatically created at the time of save. Learn more in Track processed summary table records.
- On the Data page, in the Data Sources subtable, select your data sources for the summary table.
- Optionally, use the filter to refine which transactions from the data sources are added to the summary table.
- On the Dimensions page, define the dimensions you want included in the summary table.
- In the Dimensions subtable, add your dimension. The order in which you enter the dimensions controls the index ordering, so enter them in the order of importance.
- In the Dimension Data Mappings subtable, add an entry for each dimension.
- Save your summary definition. This automatically creates the transaction event logic block table.
- On the Metrics and Display Fields page, define your metrics and, optionally, any display fields you want included in the summary table.
- In the Metrics subtable, add your metrics and select they should be calculated. Calculations can be system aggregated or logic block calculated for more complex calculations and conditionals.
- In the System Aggregated Metric Data Mappings subtable, add an entry for each metric that is system calculated, and map the field from the data source that is needed for the calculation. For example, a metric for transaction amount must have the transaction amount field mapped from the data source in order for the system to calculate the transaction amount summary value.
- Optionally, use the Display Fields subtable to configure display fields that you want included on the summary table.
- On the Transactional Event Logic Blocks page, save your definition to create the Transactional Event Logic Block Table. Then, select the Create Transactional Logic Block button to open the Logic Block Builder to configure your transactional event logic block.
Logic Block Builder
In the Logic Block Builder, create your transactional event logic block of type Cube over the Transactional Event Logic Block Table. The logic block is run during a transaction event to calculate and assign logic block calculated metrics and display fields.
Optionally, include additional complex calculations which should be applied to records as they are processed in the summary table.
Cube Summary Table Definitions
On the Transactional Event Logic Blocks page, in the Transactional Event Logic Blocks subtable, select the logic block that you want used for any logic block calculated metrics, as well as any display fields.
- Optionally, in the Transactional Event Work Fields subtable, map fields from your transaction tables that you want available in your logic block.
Once you have configured your cube summary table, select the Activate form action. Activating a summary table makes it receive data from the transactional tables it references.
Summary Table Activations
In the Summary Table Activations application, view current versions, also called activations, of summary tables. There can be multiple activations built over the same summary table. Select the Make Primary Activation row action on your summary table to make it the Primary table which the system references when the summary table is queried by outside reports.
Periodic Summary Table Definitions application
Use the Periodic Summary Table Definitions application to define the components for periodic summary tables, and to activate and manage current versions of those tables.
Learn more in the Periodic summary table configuration topic.
General page
After filling out the fields on the General page, save the definition. Saving the definition creates the Data Table and associates it with the summary table. The Data Table is the table which should be referenced when using the summary table data.
Optionally, select the Enable Record Log checkbox to track the summary table records' processing status. When selected, the Record Log Table which stores the record log data is automatically created at the time of save. Learn more in Track processed summary table records.
Data page
Select your data sources for the periodic summary table, and create unique names for different types of events. Different types of transactions within the same table can receive different dimension and metric behavior. This allows you to apply different metrics, dimensions, and logic blocks.
Optionally, create filters to limit the records which are tracked by the summary table. Records that match the filter criteria initiate the event. If a record matches multiple filters, it runs both events. If a record matched filter criteria, but then changes to not match the filter, it is removed from the summary table.
Dimensions page
Define the dimensions which form the summary table. Dimensions are used to categorize how records are summarized. Every record tracked by this summary table will be converted into a dimension set, and applied to the summary record matching all of its dimension values.
For periodic summary tables, the required dimensions are fiscal year, fiscal period, and company, but you can also define additional dimensions on this page. The ledger field can also be defined, but if left empty it will derive the primary ledger of the company. The ledger field is used specifically for understanding the fiscal calendar. All dimensions added on this page must also have data mappings assigned from one of the data sources specified.
Metrics and Display Fields page
Select the metrics you want included in the periodic table. Metrics are numeric summaries of dimension values, and are continuously updated by new transactions that impact the summary table.
Optionally, use the Display Fields subtable to configure display fields you want included on the summary table. Display fields are non-categorical values that are attached to summary table records that don’t fit into the dimension or metric categories. For example, Unit of Measure or Computation Method.
Transactional Event Logic Blocks page
Save the definition to create the Transactional Event Logic Block Table. Any changes saved to the definition are also reflected in the table. This means the transaction event table always contains the fields defined in the summary table.
Select the Create Transactional Event Logic Block button to create the logic block you want used for any logic block calculated metrics, as well as any display fields.
You can also run a logic block each time a transaction is processed in the table. Select the name of the logic block in the Transactional Event Logic Blocks subtable.
Optionally, make fields from transaction data sources available to transactional event logic blocks in the Transactional Event Work Fields subtable.
Periodic Continuity Configuration page
Select the type of continuity you want your table to have. In the Specify Continuity Dimension Set field, you can select:
—Ensures no periods are skipped in the summary table, even if no transactions occur during that time frame.—Creates the periods for an entire fiscal year when a transaction matching the dimension set for that year is entered.
Optionally, select the Specify Continuity Dimension Set checkbox to select which dimensions must be matched in records in order for the continuity behavior to be applied. If cleared, records must match all of the dimensions defined in the definition.
Periodic Roll Forward Configuration page
Configure how the data in the table should roll forward each period. Select the Modify Roll Forward Logic Block button to open the Logic Block Builder. The logic block is automatically populated with information on how to configure it.
In the Roll Forward Fields subtable, select the field you want to rollover, and the field which holds the previous value you want to add to the rollover field.
Periodic summary table configuration
Configure a periodic summary table with the Periodic Summary Table Definitions application and the Logic Block Builder.
Configure your periodic summary table with the following applications:
- Periodic Summary Table Definitions application—Build your summary table definition. Use application links and form actions to navigate to the Logic Block Builder and Summary Table Activations application as needed.
- Logic Block Builder—Configure a transactional event logic block which calculates and assigns logic block calculated metric and display fields. Once you have added it to the definition, you will then create the periodic roll forward logic block.
- Summary Table Activations application—Activate your summary table so it starts to run and receive data. Mark as Primary when you want your summary table to begin being queried by the system.
Periodic Summary Table Definitions
In the Periodic Summary Table Definitions application, you must:
- On the General page, optionally select the Enable Record Log checkbox to track the summary table records' processing status. When selected, the Record Log Table which stores the record log data is automatically created at the time of save. Learn more in Track processed summary table records.
- On the Data page, in the Data Sources subtable, select your data sources for the summary table.
- Optionally, use the filter to refine which transactions from the data sources are added to the summary table.
- On the Dimensions page, define the dimensions you want included in the summary table.
- Dimensions for fiscal year, fiscal period, and company are required.
- In the Dimensions subtable, add your dimension. You must also add the fiscal year, fiscal period, and company you already selected. The order in which you enter the dimensions controls the index ordering, so enter them in the order of importance.
- In the Dimension Mappings subtable, add an entry for each dimension.
- Save your summary definition. This automatically creates the transaction event logic block table, periodic roll forward event logic block table, and roll forward event logic block.
- On the Metrics and Display Fields page, define your metrics and, optionally, any display fields you want included in the summary table.
- In the Metrics subtable, add your metrics and select they should be calculated. Calculations can be system aggregated or logic block calculated for more complex calculations and conditionals.
- In the System Aggregated Metric Data Mappings subtable, add an entry for each metric that is system calculated, and map the field from the data source that is needed for the calculation. For example, a metric for period total must have a transaction amount mapped for the system to calculate the value.
- Optionally, use the Display Fields subtable to configure display fields that you want included on the summary table.
- On the Transactional Event Logic Blocks page, save your definition to create the Transactional Event Logic Block Table table. Then, select the Create Transactional Logic Block button to open the Logic Block Builder to configure your transactional event logic block.
Logic Block Builder
In the Logic Block Builder, create your transactional event logic block of type Cube over the Transactional Event Logic Block Table table. The logic block is run during a transaction event to calculate and assign logic block calculated metrics and display fields.
Periodic Summary Table Definitions
- On the Transactional Event Logic Blocks page, in the Transactional Event Logic Blocks subtable, select the logic block that you want used for any logic block calculated metrics, as well as any display fields.
- Optionally, in the Transactional Event Work Fields subtable, map fields from your transaction tables that you want available in your logic block.
- On the Period Continuity Configuration page, select the type of continuity you want for your summary table.
- Optionally, select the Specify Continuity Dimension Set to refine which dimensions records must match in order for the roll forward behavior to be applied to them.
- On the Periodic Roll Forward Configuration page, configure how the data in the table should roll forward each period. For example, a logic block that adds the previous period field to the current period field in order to calculate the running total for period amounts.
- Select the Modify Roll Forward Logic Block application link to configure your logic block.
- Optionally, in the Roll Forward Fields subtable, map any fields you want available for your logic block.
Logic Block Builder
In the Logic Block Builder, you must create and configure your roll forward event logic block. Instructions on how to build your logic block are available in the builder when you select the Modify Roll Forward Logic Block button.
Periodic Summary Table Definitions
Once you have configured your periodic summary table, select the Activate form action. Activating a summary table makes it receive data from the transactional tables it references.
Summary Table Activations
In the Summary Table Activations application, view current versions, also called activations, of summary tables. There can be multiple activations built over the same summary table. Select the Make Primary Activation row action on your summary table to make it the Primary table which the system references when the summary table is queried by outside reports.
As Of Summary Table Definitions application
Use the As Of Summary Table Definitions application to define the components for As Of summary tables, and to activate and manage current versions of those tables. As Of summary tables allow you to summarize data based on historical dates.
As Of summary table records summarize data in a date or date ranges. When a new record is created in the summary table, it creates a date range from the date specified up until the day before the next transaction. For example, if a transaction occurs on January 5, 2021 and the next transaction occurs on February 3, 2021, the date range for the January transaction summary table record would be 01/05/2021-02/02/2021.
Learn more in the As Of summary table configuration topic.
General page
After filling out the fields on the General page, save the definition. Saving the definition creates the Data Table and associates it with the summary table. The Data Table is the table you’ll query in a logic block when fetching data from the cube summary table.
Optionally, select the Enable Record Log checkbox to track the summary table records' processing status. When selected, the Record Log Table which stores the record log data is automatically created at the time of save. Learn more in Track processed summary table records.
Data page
Select your data sources for the summary table, and create unique names for different types of events, such as a transaction for posting an invoice and a transaction for voiding an invoice. This allows you to apply different metrics, dimensions, and logic blocks to different types of transactions.
Optionally, create filters to limit the records which are tracked by the summary table. Records that match the filter criteria initiate the event. If a record matches multiple filters, it runs both events. If a record matched filter criteria, but then changes to not match the filter, it is removed from the summary table.
Dimensions page
Define the dimensions which form the summary table. Dimensions are used to categorize how records are summarized. Every record tracked by this summary table will be converted into a dimension set, and applied to the summary record matching all of its dimension values.
For As Of summary tables, you must define an As Of Date Dimension which holds the value of the effective As Of date for the summary data records.
Metrics and Display Fields page
Select the metrics you want included in the summary table. Metrics are numeric summaries of dimension values, and are continuously updated by new transactions that impact the summary table.
Optionally, use the Display Fields subtable to configure display fields you want included on the summary table. Display fields are non-categorical values that are attached to summary table records that don’t fit into the dimension or metric categories. For example, Unit of Measure or Computation Method.
Transactional Event Logic Blocks page
Save the definition to create the Transactional Event Logic Block Table. Any changes saved to the definition are also reflected in the table. This means the transaction event table always contains the fields defined in the summary table.
Select the Create Transactional Event Logic Block button to create the logic block you want used for any logic block calculated metrics, as well as any display fields.
You can also run a logic block each time a transaction is processed in the table. Select the name of the logic block in the Transactional Event Logic Blocks subtable.
Optionally, make fields from transaction data sources available to transactional event logic blocks in the Transactional Event Work Fields subtable.
As Of Date Roll Forward Configuration
Configure how the data in the table should roll forward each period. Select the Modify Roll Forward Logic Block button to open the Logic Block Builder. The logic block is automatically populated with information on how to configure it.
In the Roll Forward Fields subtable, select the field you want to rollover, and how you want the roll forward field to appear when it is applied to future date records.
As Of summary table configuration
Configure an As Of summary table with the As Of Summary Table Definitions application and the Logic Block Builder.
Configure your as of summary table with the following applications:
- As Of Summary Table Definitions application—Build your summary table definition. Use application links and form actions to navigate to the Logic Block Builder and Summary Table Activations application as needed.
- Logic Block Builder—Configure a transactional event logic block which calculates and assigns logic block calculated metric and display fields. Once you have added it to the definition, you will then create the roll forward logic block.
- Summary Table Activations application—Activate your summary table so it starts to run and receive data. Mark as Primary when you want your summary table to begin being queried by the system.
As Of Summary Table Definitions
In the As Of Summary Table Definitions application, you must:
- On the General page, optionally select the Enable Record Log checkbox to track the summary table records' processing status. When selected, the Record Log Table which stores the record log data is automatically created at the time of save. Learn more in Track processed summary table records.
- On the Data page, in the Data Sources subtable, select your data sources for the summary table.
- Optionally, use the filter to refine which transactions from the data sources are added to the summary table.
- On the Dimensions page, define the dimensions you want included in the summary table.
- Define an As Of Date Dimension which holds the value of the effective As Of date for the summary data records.
- In the Dimensions subtable, add your dimension. You must also add the As Of Date dimension.
- In the Dimension Mappings subtable, add an entry for each dimension.
- Save your summary definition. This automatically creates the transaction event logic block table, roll forward event logic block table, and roll forward event logic block.
- On the Metrics and Display Fields page, define your metrics and, optionally, any display fields you want included in the summary table.
- In the Metrics subtable, add your metrics and select they should be calculated. Calculations can be system aggregated or logic block calculated for more complex calculations and conditionals.
- In the System Aggregated Metric Data Mappings subtable, add an entry for each metric that is system calculated, and map the field from the data source that is needed for the calculation. For example, a metric for period total must have a transaction amount mapped for the system to calculate the value.
- Optionally, use the Display Fields subtable to configure display fields that you want included on the summary table.
- On the Transactional Event Logic Blocks page, save your definition to create the Transactional Event Logic Block Table table. Then, select the Create Transactional Logic Block button to open the Logic Block Builder to configure your transactional event logic block.
Logic Block Builder
In the Logic Block Builder, create your transactional event logic block of type Cube over the Transactional Event Logic Block Table. The logic block is run during a transaction event to calculate and assign logic block calculated metrics and display fields.
As Of Summary Table Definitions
- On the Transactional Event Logic Blocks page, in the Transactional Event Logic Blocks subtable, select the logic block that you want used for any logic block calculated metrics, as well as any display fields.
- Optionally, in the Transactional Event Work Fields subtable, map fields from your transaction tables that you want available in your logic block.
- On the As Of Date Roll Forward Configuration page, configure how the data in the table should roll forward.
- Optionally, in the Roll Forward Fields subtable, map any fields you want available for your logic block.
- Select the Modify Roll Forward Logic Block application link to navigate to the Logic Block Builder.
Logic Block Builder
In the Logic Block Builder, you must create and configure your roll forward event logic block. Instructions on how to build your logic block are available in the builder when you select the Modify Roll Forward Logic Block button.
As Of Summary Table Definitions
Once you have configured your summary table, select the Activate form action. Activating a summary table makes it receive data from the transactional tables it references.
Summary Table Activations
In the Summary Table Activations application, view current versions, also called activations, of summary tables. There can be multiple activations built over the same summary table. Select the Make Primary Activation row action on your summary table to make it the Primary table which the system references when the summary table is queried by outside reports.
Track processed summary table records
Summary tables can be configured to track the status of their processing records.
This configuration can be applied to the Cube Summary Table Definitions, Periodic Summary Table Definitions, and As Of Summary Table Definitions applications.
Summary table definition
On the General page of your summary table definitions application, you must:
- Select the Enable Record Log checkbox.
- Save the definition record to prompt the system to create the Record Log Table. This is the table you query if you want record log information.
Table definition
In the Table Definitions application, you must:
- Create a new table of type
Join. - In the Join Type field, select
Left Outer Join. - In the
Primary Join Table, select the name of the transaction table from your summary table definition which you want to track. - In the Secondary Tables subtable, select the name of the table populated in the Record Log Table field of the summary table definition.
- In the Join Fields subtable, you must:
- In the JoinFields.Table1Fields, specify
nwId. - In the JoinFields.Table2Fields, specify
STFDataSourceRecordId.
- In the JoinFields.Table1Fields, specify
View data
Once you definition is configured, you can build either an interactive report or application over the join table. This allows you to view the record log information in the report data table of the report or the list form of the application.
Summary Table Activations application
Use the Summary Table Activations application to view, deactivate, delete, and manage different versions of summary tables, also called activations.
Multiple versions of a summary tables can be built over the same data table. These activations can run and receive data simultaneously from the underlying transactional tables while you build, test, and prove the functionality of the new table. This allows you to build the new table without having to stop using the old one. Only the primary activation is referenced by interactive reports and logic blocks when they reference the data table. Select the Make Primary Activation row action to activate a table. This automatically deactivates a summary table if it was previously marked as the Primary activation.
Open a summary table record to view information about the activation, such as the:
- Status—Indicates the current status of the activation. Only
Loading,ActiveandOut of Syncactivations receive data from the transaction tables which feed the summary table. - Error Tolerance—Indicates the number of failed events which may occur on the table before it becomes corrupted and can no longer receive data.
- Primary—Indicates which activation table is referenced by the system when the table is queried by outside applications or reports. Only one activation can be selected as the primary.
Summary Table Events application
System administrators use the Summary Table Events application to view transactions going in and out of summary tables.
Summary table best practices
These best practices ensure that summary tables are configured consistently throught Nextworld.
Create a summary table at the most general level of dimensions and metrics you can. Then, leverage interactive reports to further aggregate, pivot, and filter the data.
Data Sources
There are several considerations for your summary table data sources, including:
- If your data source is a Detail table, any applied filters should be on values from the Detail table. Only changes made in the Detail tables are tracked by the system.
- If your data source is a Detail table, you only need to define the Header Detail table if Header fields are used.
Dimensions and Metrics
There are several considerations for dimensions and metrics, including:
- If you are creating a dimension related to a table lookup, use the table lookup data item. If you use the related fields, it can become out of sync if the table lookup changes.
- If a field is both on the Header and the Detail table, it is more performant to use the Detail table field.
- Not all metrics require mappings. You may be reading multiple tables and only have one table that holds the metric, such as Debit and Credit amounts. Only map what you need to map.
Display Fields
There are several considerations for display fields, including:
- Display fields should typically be fields that describe an aspect of a metric, but are not functional categorizations. For example, if your summary table is modeling inventory items, you could use Unit of Measure as a display field since it is connected to an item dimension.
- Functionally, display fields and logic block calculated metrics are the same. Use logic block calculated metrics for numeric calculations and display fields as descriptors. For example, Percent of Total would be an appropriate Metric, while Unit of Measure is an appropriate Display Field.
- Use the format of <FieldName><Work> when naming any transaction event work fields. For example,
UnitOfMeasureWork.
Logic blocks
- Generally, it is not recommended to use Interrupt with Errors within transactional event logic blocks. This can break the summary table, depending on the allowable error tolerance.
- You should define both an insert and removal event type for your transactional event logic blocks. Removal covers cases where a transaction changes and no longer fits the summary record criteria.
- Assign your logic blocks to an event data source. If you don’t have a specified data source and then the summary table is extended in the future, any additional data sources would also be impacted by the logic block.
Interactive reports performance considerations
This topic covers the best practices for improving performance in your interactive reports, and the guidelines for data volume.
Report performance can be improved through use of:
- Filters—Narrow the amount of data being processed through use of selective filters. For example, filter with specific dates or date ranges, table lookups, or other numerical values to improve response times. Use required pinned filters to ensure certain filters are applied before querying for data.
- Flat list report layouts—Return a set number of records with a flat list layout. This is the preferred layout type for large amounts of data.
- Smaller groups—Group records based on less unique values. For example, if you group records based on company or org unit, you would have a limited number of groups. If you group based on transaction IDs, each record would have its own unique group.
- Limited calculated columns—Select only the calculated columns necessary for your report. Having a large number may decrease efficiency.
Performance considerations
Complex reports with large volumes of data may encounter performance degradations or time out errors. In general, you can expect the following results with different data volumes:
- 500,000 records or less—Expect records to be returned.
- 1,000,000 records—Likely to be performant and return records, though complex pivots or row groups may cause degradation.
- 3,000,000 records—Filtering your data is advised.
- 5,000,000+ records—Highly selective filtering is necessary for performance.
Complex pivot and row groups can impact performance. Consider changing your inputs if you experience any latency.